The HighLAND framework (HIGH Level ANalysis Development) is designed to simplify the process of analysing data in particle detectors. It allows the user to quickly run analyses, plot results, evaluate the impact of systematic errors and much more. To allow this two set of packages have been identified:
- PSyCHE (Propagation of Systematics and CHaracterization of Events) is a high performance set of packages which performs event selection and propagation of systematics.
- HighLAND: use the PSyChE packages as core, and it adds in addition Corrections, FlatTree creation, tools for Drawing, etc. In practice PSyChE is part of the HighLAND distribution.
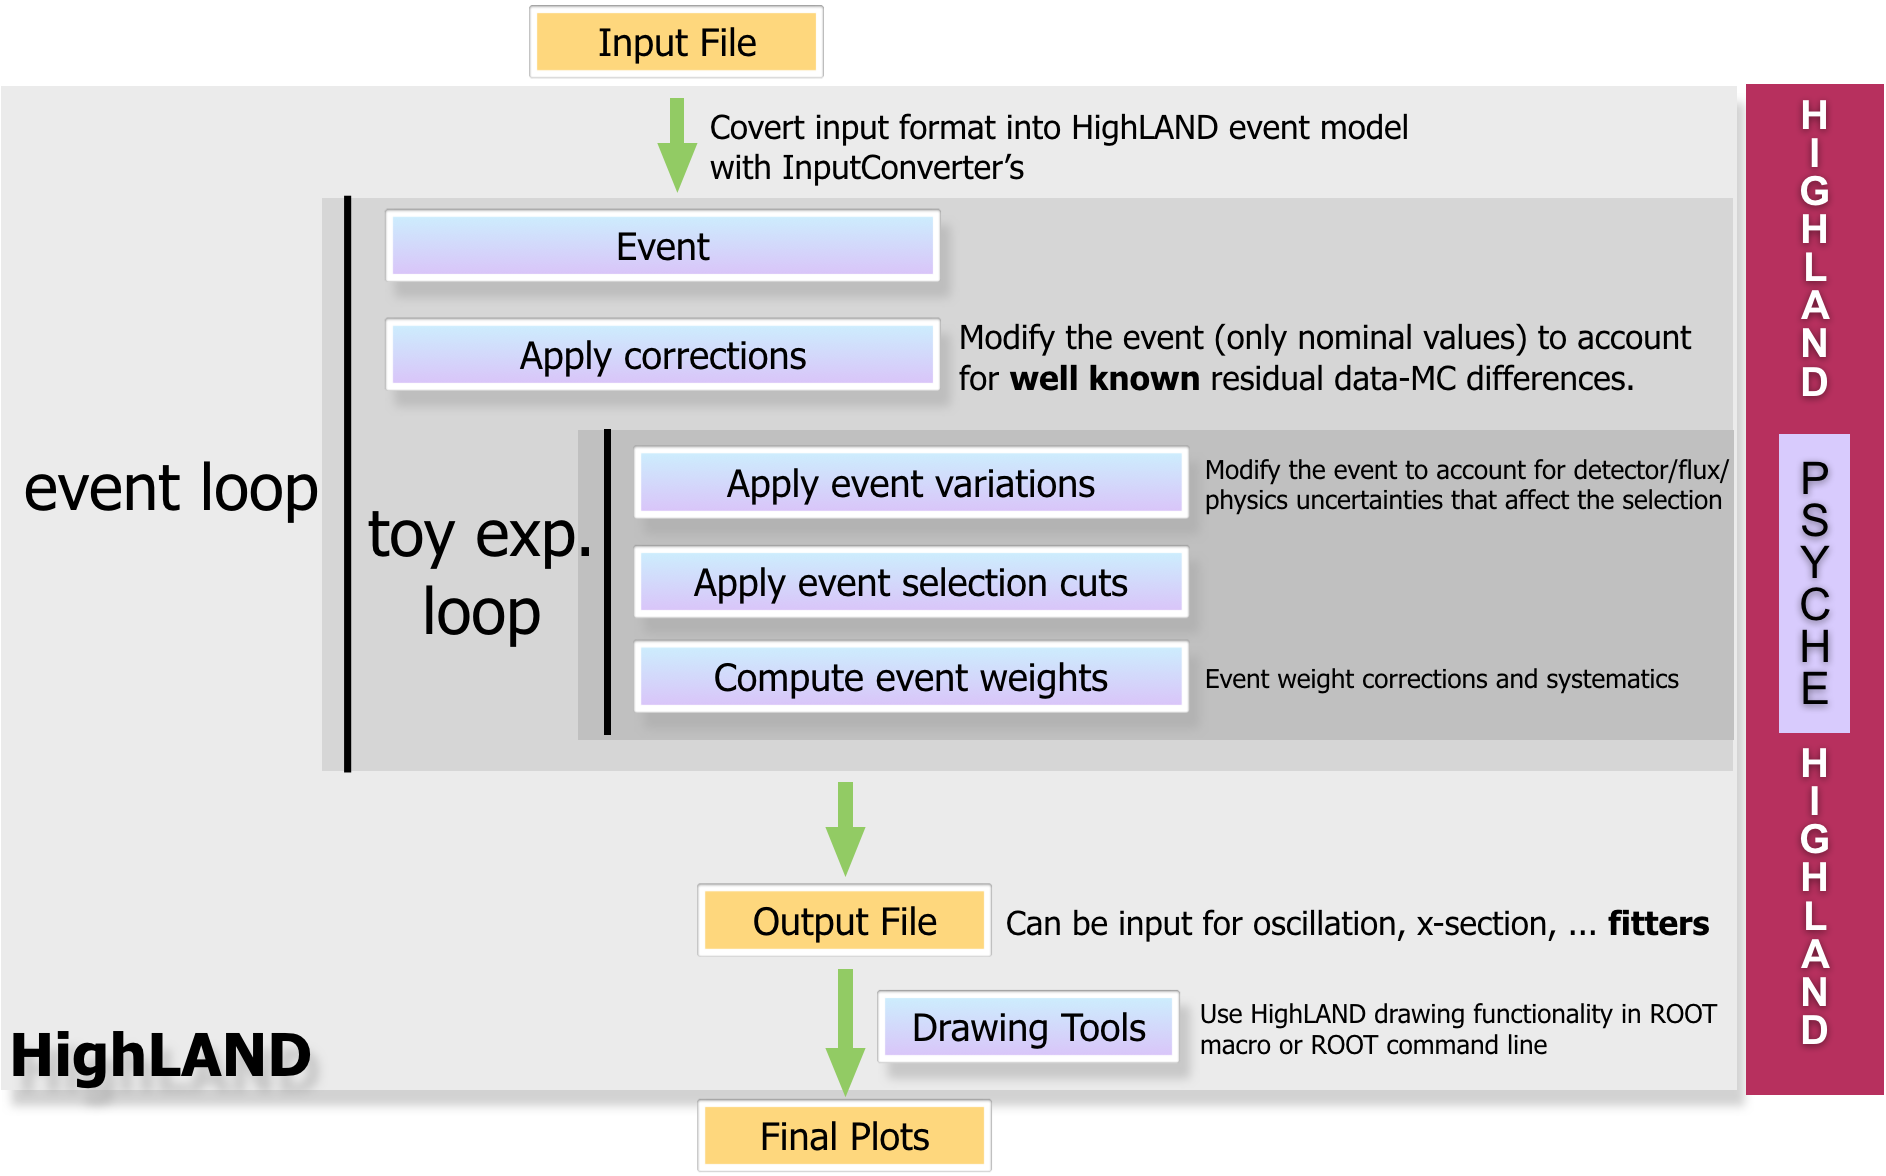
The analysis flow is in the above diagram. For every event a set of corrections are applied to make data and MC agree better. Then a loop over toy experiments is done, each toy experiment will be an independent analysis of the same event, in which the event properties are varied. This allows propagating systematic errors numerically. For each toy experiment, a set of event variations change some aspect of the data. The event selection proceeds then on that modified data. Finally, a weight for the event in this particular toy experiment is computed, to account for systematics that cannot be propagated as variations, and for event weight corrections. Those three operations, event variations, event selection and event weights are performed by PSyCHE. HighLAND provides in addition the infraestructure to do the event loop, apply corrections, create and fill root trees that can be easily analysed using a set of tools for drawing (also provided by HighLAND), extensions to the event model, etc.
Each analysis that uses the framework defines its own executable, for example a hypothetic analysis package called myAnalysis would have an application RunMyAnalysis.cxx. The output of this executable is a root file with several trees. Some of them contain a summary of the variables used in the analysis as well as selection cuts information (those are called micro-trees: default, all_syst, ...), while there are also single-entry trees containing more general information such as the amount of POT that was analysed (header tree), and configuration information for the analysis (config tree). The output file can then be analysed using a simple ROOT macro, and the DrawingTools methods provide many useful functions for doing this.
The following related pages contain more detailed documentation:
- An overview of the concepts: event model and data classes, corrections, systematics, configurations, event loop, ...
- Structure of the framework and package hierarchy
- How to analyse events with the micro-tree and the DrawingTools
- All you need to know about the DrawingTools
- Propagating and drawing systematic errors (WORK IN PROGRESS!!)
- More advanced tips for implementing an analysis
- Install highland2/psyche
- Implementing your own analysis package - a tutorial
- Common warnings and error messages
- The Flat Tree: how to save time and space
- Handling different oaAnalysis file formats: versioning, different productions, ...
- Committing your analysis package to the repository
- List of highland2 packages and managers
- From highland to highland2
- Tips for processing all the ND280 data in highland