|
 Pattern recognition. Pattern recognition.
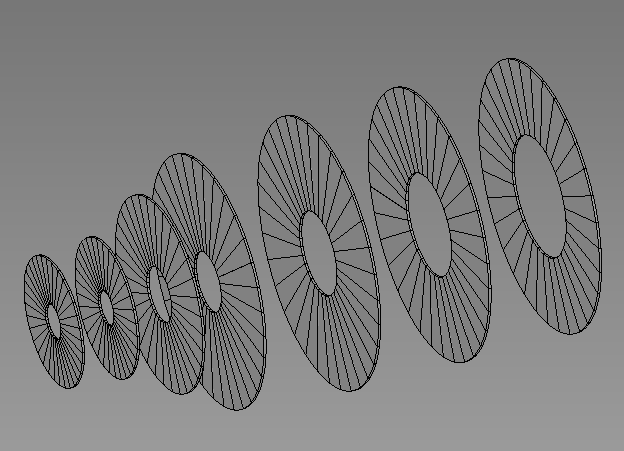
After the analysis of the global pattern recognition performance of the complete LDC geometry - including VXD, SIT, TPC and FTD - in the previous section , this section aims to provide a more detailed insight in the specific capabilities of the Forward Tracker. In this section the hit density in the Forward Tracking Disks is evaluated. The occupancy for several technologies is determined. In the next section, a realistic standalone pattern recognition algorithm is used to determine the intrinsic pattern recogntion capabilities of the FTD.
Hit density
Naturally, the density of hits per unit area is one of the principal markers for the pattern recognition performance of the detector. In most detectors the detector granularity is chosen such that it roughly follows the hit density variations over the tracking volume.
The density of hits per unit area in each detector layer is determined by the detector layout and the material. In particular, this marker is essentially independent of the underlying technology.
In the figures below, the hit density per mm2 and per bunch crossing is shown for the central inner tracker (leftmost figure) and for the forward tracker (rightmost figure).
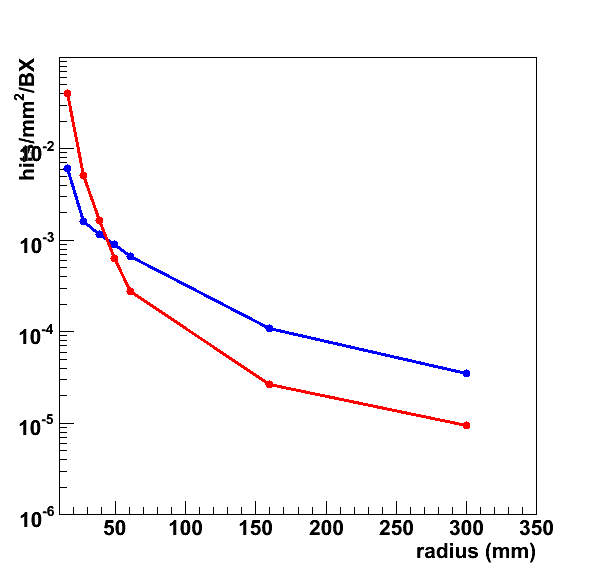 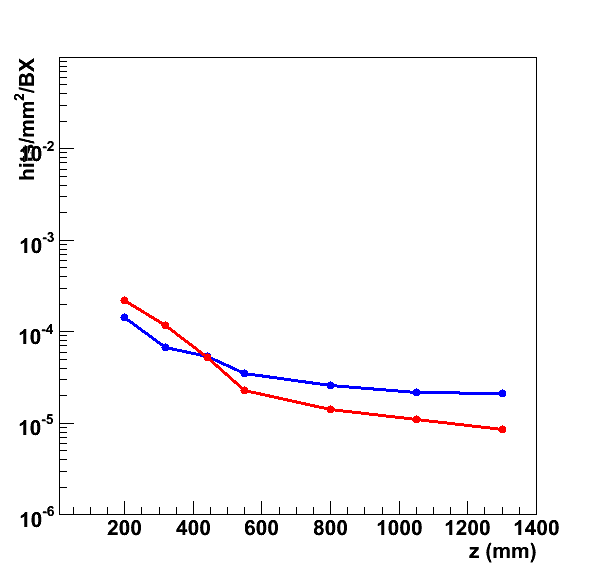
The blue line indicates the average hit density in a high-multiplicity signal topology: tt events. The red markers correspond to the background hit density for nominal operation.
Results for the background contribution to the hit density in several other operating scenarios of the accelerator are presented in the section on machine induced backgrounds.
Some care is required when interpreting the average hit density. The average over entire detector layers may hide important variations over the detector area.
Important variations of the hit density occur in hadronic signal topologies. Jets of particles lead to highly localized areas with large peak density. In the figure the hit density in 250 GeV jets is shown as a function of the distance to the center of the jet.
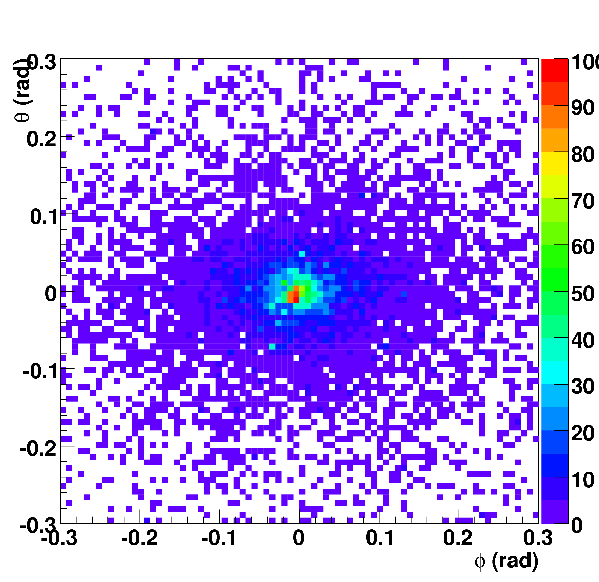
Clearly, the hit density varies strongly with angular distance ( &Delta &phi, &Delta &theta ) to the center of the jet. For these high pT jets, typically more than half of the tracks belonging to the jet are within 100 mrad from the jet axis. For the innermost detectors (VXD, SIT, first FTD disks) the magnetic field does not signficantly wash out the jet structure.
To take into account the non-uniformity in the hit density, the local hit density has been defined. In this case, hits are counted in a small region surrounding each hit. The density is normalized to the area of the region. In hadronic final states with jets the local density is two orders of magnitude larger than the average density.
Another source of non-uniformity is the hit density due to beam-induced background in the forward tracker: the large majority of background hits tend to accumulate in the inner ring of the forward disk, leading to a peak hit density that is five times larger than the average density.
Occupancy
To estimate the channel occupancy (i.e. the probability that an electronics channel has a hit) the hit densities that were determined in the previous section are convoluted with the cell area. Typically, the cell area - the area corresponding to a read-out channel - is that of the read-out segment (i.e. the strip area for micro-strip detectors, pixel area, etc.).
In the table below the channel occupancies of three silicon detector technologie are listed. In the second column the typical cell size of the technology is listed. The third and fourth column contain the average and the peak occupancy. The results correspond to the innermost Forward Tracking Disks. Clearly, the background contribution varies significantly over the length of the FTD: the last four disks have to cope with an order of magnitude less hits/mm2. The reduction of the signal hit density is much less pronounced.
| Technology | cell area | avg. occ. | peak occ. |
| | ( &mu m 2) | (#hits/channel) | (#hits/channel) |
| Pixel | 25 × 25 | 6 × 10⁻⁸ + 1 × 10⁻⁷ / BX | 6 × 10⁻⁶ + 1 × 10⁻⁶ / BX |
| Macro-pixel | 50 × 500 | 2 × 10⁻⁶ + 4 × 10⁻⁶ / BX | 2 × 10⁻⁴ + 4 × 10⁻⁵ / BX |
| std. strips | 50 × 105 | 5 × 10⁻⁴ + 10-3 / BX | 5 × 10⁻² + 10-2 / BX |
The entries in the table are of the form: a + b/BX, where a corresponds to the signal occupancy and b to the contribution of the machine background due to a single bunch crossing. The separate listing of signal and background occupancies allows the determination of the total occupancy for technologies where the read-out time exceeds the approximately 300 ns between bunch crossings. In this case the occupancy is obtained by multiplying the background contribution by the number of integrated bunch crossings.
In the innovative pixel technologies envisaged in the ILC vertex detector - the first row in the table - very small pixel sizes are possible. If single bunch-crossing read-out becomes a reality, the occupancy can be made as small as 7 × 10⁻⁶
The read-out time of present-day active-pixel detectors and CCDs (with in-pixel memory) typically spans several hundred bunch crossings. If such technologies are applied to the forward region the total occupancy is dominated by the contribution from machine background. The resulting total occupancy is of the order of 1 × 10⁻⁴.
The second row in the table corresponds to hybrid pixel technologies with rectangular pixels of 50 × 400 &mu m 2 (macro-pixels) like those of the ATLAS pixel detector. One of the advantages of hybrid pixel detectors is the fast read-out. The larger cell size is compensated by the single bunch-crossing read-out. rovide a peak occupancy of 2 × 10⁻⁴, comparable to the innermost (pixel) layers of the LHC trackers.
Silicon micro-strip technology yields detectors with a typical cell size of 50 &mu × 10 cm that is several orders of magnitude larger than that provided by pixel detectors. In part the larger cell size is compensated by the possibility of single bunch crossing read-out. The expected peak occupancy in the innermost disks is 5 %.
Note that this result is equally valid for double-sided (or false double-sided) detectors. Considering other pattern recognition aspects double-sided detectors form an intermediate solution between pixel and strip technology (and hence their use for the intermediate radii of the ATLAS and CMS inner detector). However, in terms of readout channel occupancy double-sided and single-sided detectors with the same strip length yield identical results.
Discussion
In this section, the hit density and occupancy in the FTD have been evaluated using fully simulated dense signal topologies plus the underlying machine background.
For high-multiplicity signal topologies like tt-events the hit density in the FTD ranges from 1.5 × 10⁻⁴ hits/mm2/BX for the innermost disks, to 2 × 10⁻⁵ for the outermost disk. The local hit density in jet cores is two orders of magnitude larger. The hit density due to machine background in nominal machine operation is of the same order, but falls more rapidly towards the outermost disks. The peak hit density due to background - in the inner rim of the first disks is a factor 5 larger than the average density.
The hit density, convoluted with the detector technology, yields an estimate for the occupancy.
For the innermost detector layers the much larger cell area of micro-strip technology when compared to pixel detectors leads to relatively high occupancy: peak values of 5 % are expected: excessive if stand-alone pattern recognition is required.
The most granular detector technologies can provide occupancies as low as 10-5 provided small pixel sizes and fast read-out can be brought together in a single technology.
Currently available technology either integrate multiple bunch crossings ( ILC vertex detector candidates ) or larger pixel sizes (hybrid pixel technology). Thus, today's best achievable occupancy is of the order of 10-4.
Home
Next Article
|