|
 Machine Backgrounds. Machine Backgrounds.
Previous studies of the background levels have established that machine-induced background is an important constraint in the vertex detector design. The abundance of hits due to pair production off beamstrahlung photons is such that it is a crucial factor in the design of the vertex detector read-out scheme. The background level in the tracker has received less attention. In this section, existing background level estimates are extended to the forward and innermost central regions of the tracker.
Incoherent pair production
When the two bunches of the ILC collide, the electrons are disturbed by the electromagnetic field of the incoming bunch. Under this influence, the electrons radiate photons (an effect known as beamstrahlung). The produced photons may convert into pairs of an electron and a positron through one of the processes whose diagrams are depicted in the figure below.
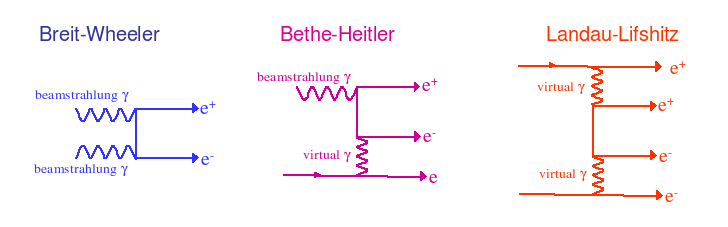
The complex interaction of the colliding bunches is modeled in a dedicated generator: GuineaPig. The real-real Breit-Wheeler process is calculated explicitly, while for the Bethe-Heitler and Landau-Lifshitz the Equivalent Photon Approximation is used. Details on the model can be found in this article . A supporting web page has been set up at LAL.
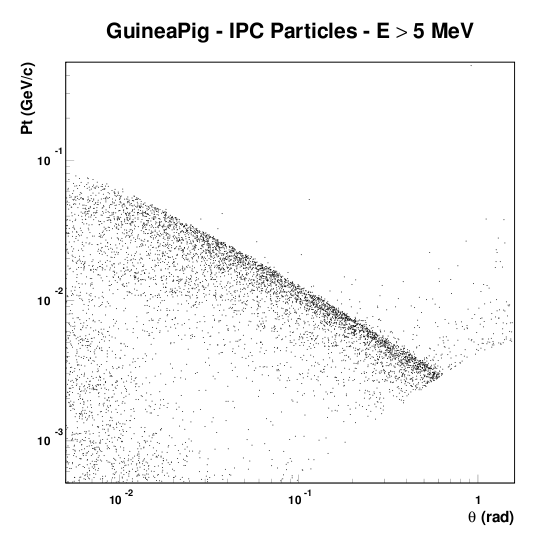
The generated spectrum and angular distribution of the produced electrons and positrons is shown in the lefmost figure below. The initial distributions are distorted as the electrical field of the bunches sweeps away the produced electrons and positrons. This important effect is included in the Guinea Pig generator. In the rightmost scatter plot (from EUROTeV-Report-2005-016-1.), the final pT- &theta distribution is shown. Clearly, there is a strong anti-correlation between transverse momentum and polar angle: particles that are emitted at large angle with respect to the beam tend to be very soft. Most particles accumulate in narrow band in the transverse momentum-polar angle view.
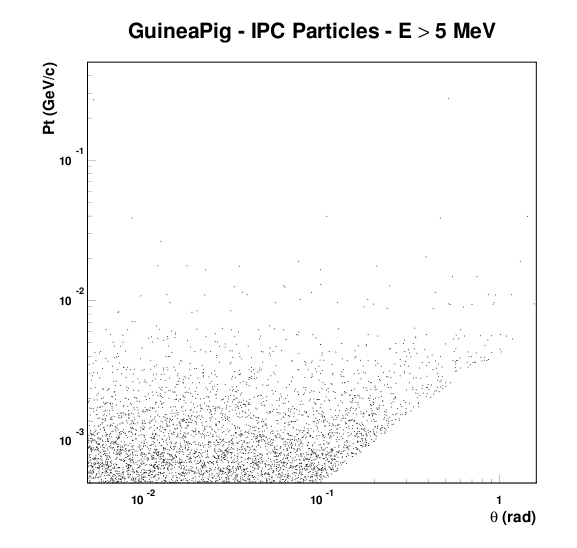 
The electrons and positrons produced in the interaction between the colliding bunches are generally emitted at low angle with respect to the beam axis and with small momenta. Typical transverse momenta are in the MeV range. Only a small fraction of the electrons/positrons is produced at a transverse momentum exceeding 100 MeV.
Machine parameters
The amount and properties of the background depend on a series of machine parameters.
A critical parameter in the estimate of the background level is the bunch structure of the accelerator. In the figure below, the envisaged time structure for the ILC based on superconducting cavities (the so-called "cold technology") is depicted schematically.
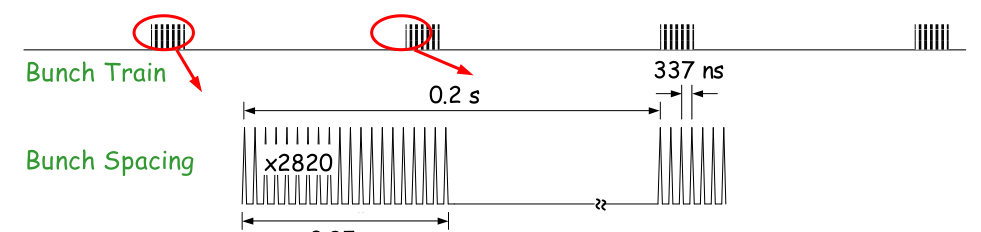
As can be read from the figure, it is foreseen that every 200 ms there is a very brief (1 ms) bunch train consisting of (nominally) 2820 bunches colliding at regular intervals of (nominally) 337 ns. During the 200 ms inter-bunch time, no collisions occur.
The background level in the detector depends strongly on the integration time. Detectors with a time resolution smaller than ~300 ns can distinguish individual bunch crossings and are therefore affected by a single bunch crossing's worth of background. Detectors that integrate much longer intervals (of the order of 1 ms) may see a background level that is three orders of magnitude larger.
The intensity of the machine-induced background moreover depends strongly on the parameters of the final focus system in the interaction point. Several sets of parameters have been defined. The different sets span the range of possible parameters for the ILC.
The impact of the final focus parameters on the beamstrahlung spectrum is clearly visible in the figures below. The leftmost figure corresponds to nominal 500 GeV parameters, the rightmost figure to the low power option at the same center-of-mass energy.
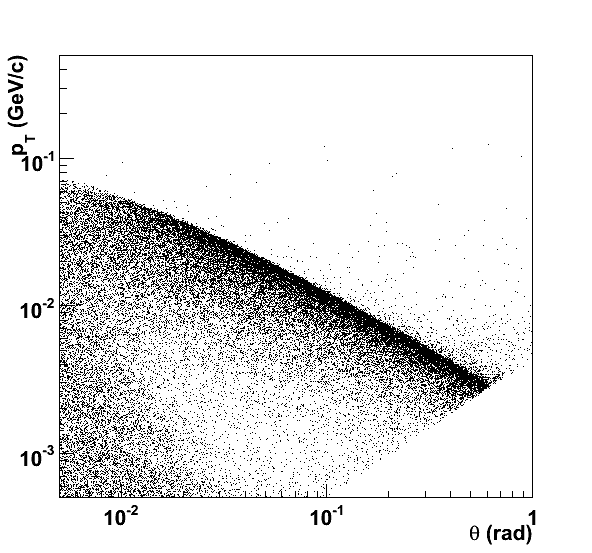 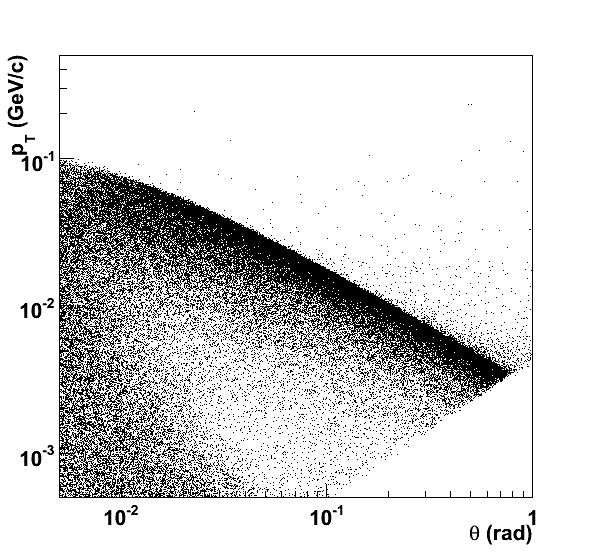
Comparison of the two figures reveals an upward shift of the high-intensity band in the low power option. Particles at the same polar angle tend to have larger transverse momentum. Thus, the overall probability of reaching a detector element of the vertex detector of forward tracker increases significantly.
| parameter | N | bunch spacing | &beta x | &beta y | &gamma x | &gamma y | &sigma z |
| unit | (1010) | (ns) | (mm) | (mm) | (mm × rad) | (mm × rad) | ( &mu m) |
| nominal | 2.05 | 369.2 | 20.0 | 0.4 | 10.0 | 0.04 | 300 |
| high-lumi | 2.05 | 369.2 | 11.0 | 0.2 | 10.0 | 0.03 | 150 |
| low-power | 2.0 | 480.0 | 11.0 | 0.2 | 10.0 | 0.036 | 200 |
| low-Q | 1.0 | 189.2 | 11.0 | 0.2 | 10.0 | 0.03 | 200 |
| large-Y | 2.0 | 369.2 | 11.0 | 0.6 | 10.0 | 0.08 | 500 |
Table: final focus parameters in different scenarios for a center-of-mass energy of 500 GeV. For details, see RDR.
| parameter | N | bunch spacing | &beta x | &beta y | &gamma x | &gamma y | &sigma z |
| unit | (1010) | (ns) | (mm) | (mm) | (mm × rad) | (mm × rad) | ( &mu m) |
| nominal | 2.0 | 369.2 | 30.0 | 0.3 | 10.0 | 0.04 | 300 |
| high-lumi | 2.0 | 369.2 | 10.0 | 0.2 | 10.0 | 0.03 | 150 |
| low-power | 2.0 | 480.0 | 12.0 | 0.2 | 10.0 | 0.035 | 200 |
| low-Q | 1.0 | 189.2 | 15.0 | 0.2 | 10.0 | 0.03 | 150 |
| large-Y | 2.0 | 369.2 | 12.0 | 0.6 | 12.0 | 0.08 | 600 |
Table: final focus parameters in different scenarios for a center-of-mass energy of 1 TeV.
Fast simulation
To study the background levels for different geometries, magnetic field configurations and machine parameters, a fast simulation tool has been created following the work of the MDI group at LAL Orsay (Cecile Rimbaud et al. EuroTeV report (EUROTeV-Report-2005-016-1).). The fast simulator is intended to cover the forward tracker region. The four-momenta of electrons and positrons resulting from a beam-beam interaction are taken from the Guinea-Pig simulation. The trajectory of all secondaries is calculated analytically following an ideal helix. Reflections on downstream material are ignored. Magnetic field and detector geometry are those of the Large Detector Concept.
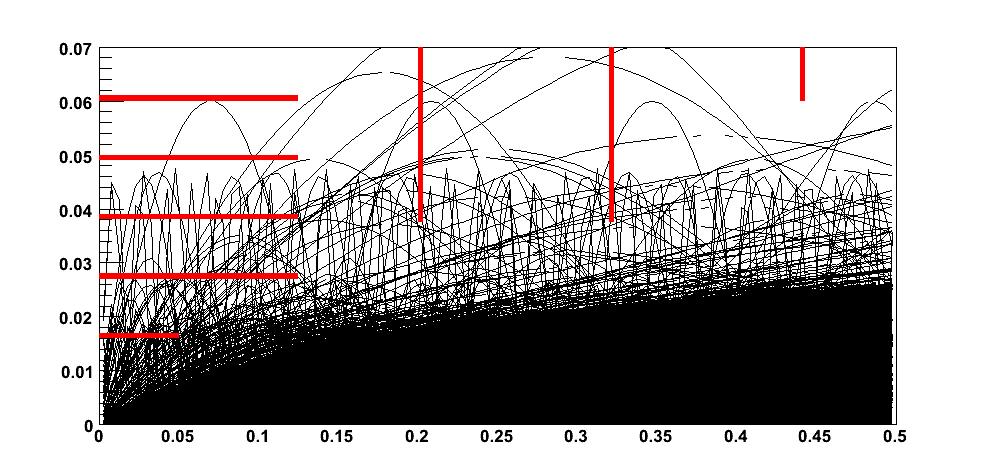 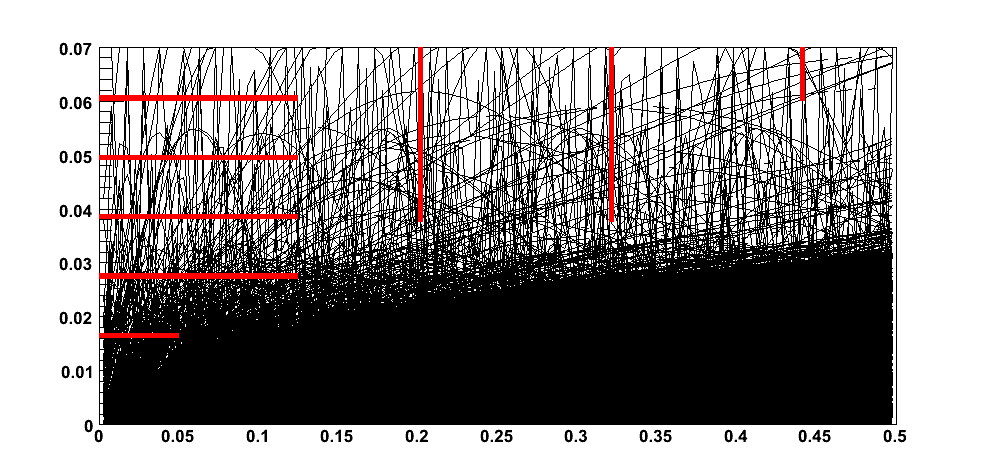
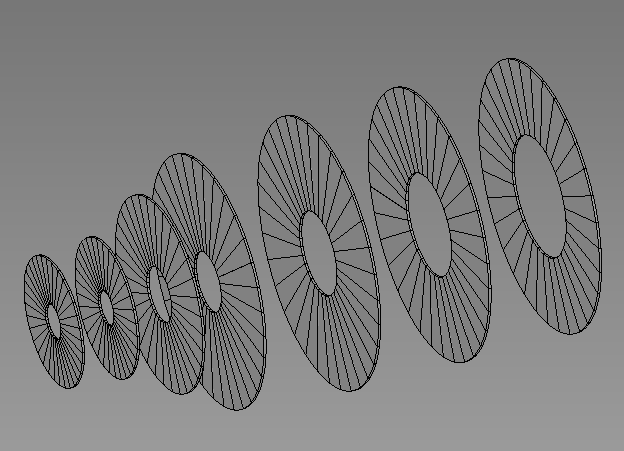
To show the effect on the detector occupancy, in the figures above the trajectories for all charged secondaries with a transverse momentum over 10 MeV are shown. The two figures correspond to two different parameter sets for the final focus: nominal (leftmost figure) and low-power (rightmost figure). The increase in activity at larger radii for the low power settings is clearly visible.
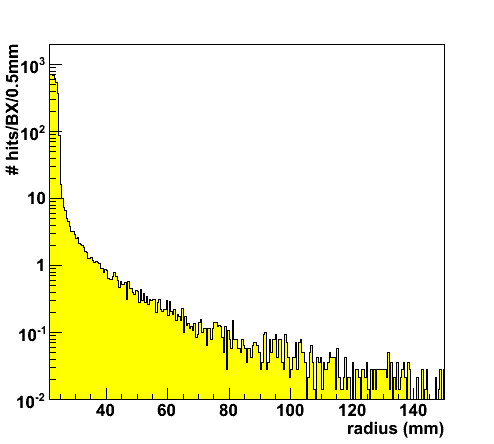
To gain a quantitative understanding of the hit densities due to pair background, events corresponding to 140 bunch crossing have been generated using GuineaPig. The output is processed with the fast simulation tool. For the seven detector planes in the LDC geometry the hits are counted versus distance to the beam axis ("radius"). The exercise is repeated for each combination of magnetic field and machine parameters. The result is a series of figures like the histogram on the right.
To determine the hit density, all hits between detector inner and outer radius are counted. The result is normalized to the detector area and to a single BX. The distribution of hits over the detector surface is far from uniform. Therefore, the hit density in the innermost 5 mm ring is determined as well. This is referred to as the peak hit density.
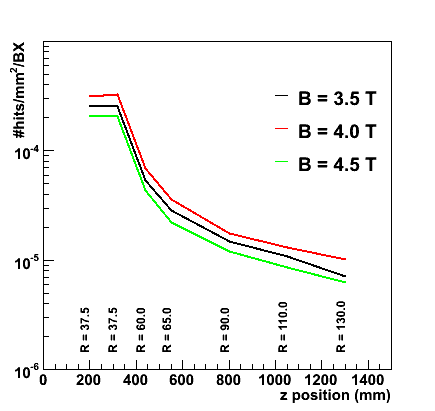
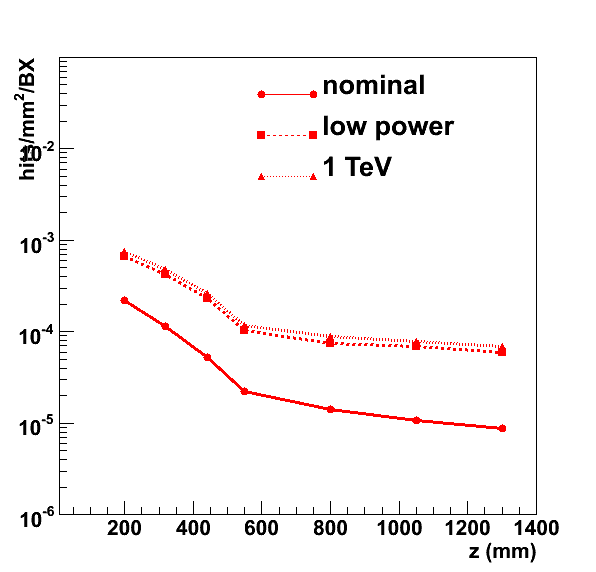
The results for the seven disks, for all possible machine parameters and three different magnetic field strengths are presented in the table following this link. The figures below summarize some of the most important findings for nominal machine parameters. The average hit density is plotted versus the distance along the z-axis to the interaction point. Clearly, due to their small inner radius the first two disks are exposed to nearly an order of magnitude more background than disks 3 through 7. The three curves correspond to three values of the magnetic field strength; 3.5 Tesla (red) , 4 Tesla (nominal, black) and 4.5 Tesla (red). As expected, an increase in the field strength - for equal layout - somewhat reduces the hit density. Typically, in the range of field strenghts studied here, the hit density changes by less than a factor two for each 0.5 Tesla.
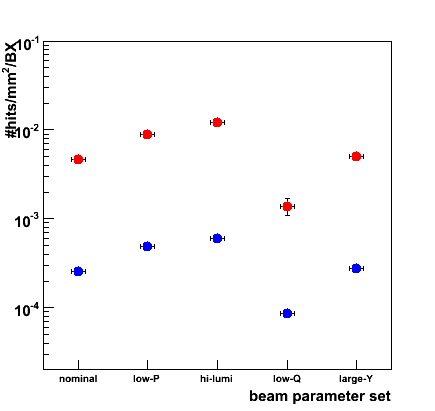
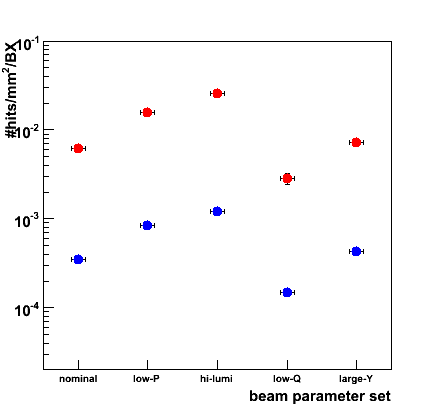
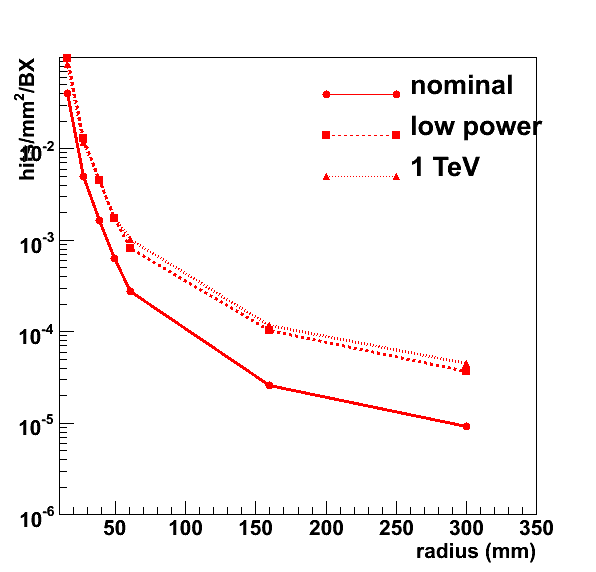
The hit density depends strongly on machine parameters. In the figures below the hit density in the second disk (blue markers) is shown for the five parameter sets for a 500 GeV linear collider (leftmost figure) and a 1 TeV machine (rightmost figure). The hit density varies quite strongly, over nearly an order of magnitude, between the five scenarios. The upgrade to a 1 TeV collider leads to a duplication of the hit densities.
The second set of markers (red points) indicate the peak hit density in the inner rings of the detector. The highly non-uniform distribution leads to a peak density that is roughly a factor 5 larger than the average over the whole disk.
The most striking feature in the hit count versus radius in all detector planes is a very strong increase of the hit density at a given radius - visible at the lowest radii in the figure above. In a narrow band of a few mm the hit count increases by three orders of magnitude. The "accumulation zone" presents a hard limit beyond which track reconstruction - or even survival of the detector - is practically impossible.
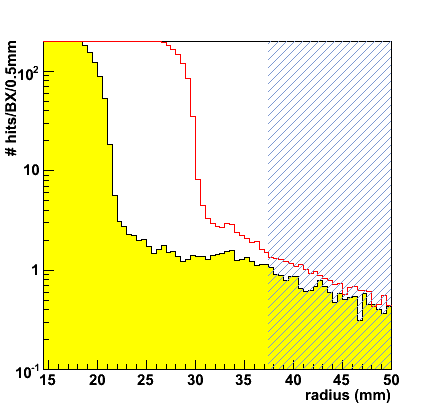
A detailed view of the accumulation zone in case of high luminosity operation of the ILC at 500 GeV for the innermost two Forward Tracker Disks. The histograms with the yellow fill colour correspond to the first disk, the red line outline the histogram of the second disk. In the nominal LDC layout both disks have the same inner radius, indicated in grey shading. Clearly, the situation of the second disk is most critical: the distance between the inner radius of the active detector and the accumulation zone is 7 mm.
The outer radius of the accumulation zone for the X,Y plane of the first four Forward Tracking Disks is indicated in the table below.
| disk | detector inner radius (mm) | Racc nominal, B = 4 T (mm) | Racc low power, 4 T (mm) | Racc high lumi, 4 T (mm) | Racc high lumi, 3.5 T (mm) | Racc high lumi, 4.5 T (mm) |
| 1 | 37.5 | < 15 | 16 | 21 | 22 | 21 |
| 2 | 37.5 | < 15 | 24 | 30 | 31 | 28 |
| 3 | 60.0 | < 15 | 30 | 35 | 38 | < 32 |
| 4 | 65.0 | < 15 | 33 | 38 | 41 | 38 |
Full simulation
To give a precise and quantitative estimate of the hit density due to machine background a full simulation of the interaction with the detector of the pairs generated with GuineaPig is required. Within the scope of the Large Detector Concept, such simulations have been performed by Adrian Vogel for a number of parameter sets of the accelerator. The most complete presentation of his result today is his Desy LCWS 2007 and in the Valencia ILC workshop
The GEANT4 model includes a detailed description of the detector and of the magnetic field. Especially important is the correct description of the material immediately surrounding the beam pipe, as a significant fraction of the background levels may be induced by particles backscattering from upstream material. In the table below, the fraction of direct hits is given for the three innermost tracker subsystems. Non-direct hits make up a very significant fraction of the occupancy in the vertex detector, and even dominate in SIT. Clearly, the results from the fast simulation - that ignores completely the non-direct contributions - should be interpreted with care.
| Sub-detector | % direct hits |
| VXD | 73% (layer 1) - 55% (layer 5) |
| SIT | 29 % (layer 1) - 26% (layer 2) |
| FTD | 54 % (disk 2) - 40 % (disk 7) |
| Sub-detector | Low power (*) | 1 TeV |
| VXD | +20-50% | x2-2.5 |
| SIT | x 2 | x4 |
| FTD | x 2 | x 4 |
Change in hit densities with respect to nominal 500 GeV operation.
(*) per unit time, corrected to accomodate for factor 2 (BX frequency)
While the model in the full GEANT simulations is very detailed, its scope is limited to the length of the beam line embedded in the detector. Olivier Dadoun has studied the contribution from backscattered photons induced by beam losses in the extraction line (i.e. further upstream). The results are summarized in his presentation in LCWS 2007 at DESY. It is found that beam losses in the extraction line contribute significantly (10 % of the level due to direct hits and backscatters within the detector) to the number of hits in the vertex detector. For the results that follow this contribution is ignored.
The hit densities due to pair production background in a single bunch crossing are shown in the figures below.
Summary
Machine-induced pair production is a source of background hits. In the forward tracker as envisaged for the LDC the hit density in the first two disks reaches 2 × 10⁻⁴ hits/mm2/BX for nominal final focus parameters and magnetic field strength. Thus the background level is comparable to that of the outermost vertex detector layer, well below the level that the innermost vertex detector layer has to cope with.
The dependence on the machine parameters is somewhat stronger than in the vertex detector: the low-power option leads to a factor two increase with respect to nominal settings. For a 500 GeV machine in high-lumi operation or a 1 TeV machine with nominal settings, the background level increases by a factor 4.
As expected, a stronger magnetic field may be used to reduce the background: half a Tesla increase leads to a factor two reduction. A reduction of the field strength by half a Tesla, on the other hand, leads to an increase by about the same factor.
An analysis of the distance to the so-called accumulation band has been performed. The accumulation band presents a hard limit to the inner radius: at a given radius the hit density increases - by two orders of magnitude - to a prohibitive level in a matter of several mm. This analysis shows that the situation in the LDC is most critical for the second disk. While there is quite some margin in the design for nominal machine parameters, in some of the alternative parameter settings - particularly low-power and high-luminosity - the inner radius of the (active) detector is within 13 mm, respectively 8 mm of the high-density region.
While not quite at the level of the vertex detector, the hit density in the forward tracker presents a constraint and a challenge to the design. The background hit density must be coped with by a combination of fast read-out and detector granularity.
Home
|