Introduction
The situation in this beam test is quite different from the ones we're used to:
The (off-line) cut on the charge deposition time - of vital importance in conventional test beams - has now become obsolete. The charge deposition moment with respect to the sampling moment is defined to within a few nanoseconds (clock and trigger jitter). We can scan the delay between charge deposition and sampling adding small extra lengths of cable to the trigger cable.
On the down side, there is less spatial information as the telescope has been reduced to 2 times 2 planes. In the high intensity runs the telescope becomes useless altogether, as its shaping time is too long for these rates. Therefore, a slight adaptation of the conventional test beam analysis (defining efficiency by comparing the response from DUTs to a known track reconstructed from telescope and reference modules) has been applied to the low intensity runs. A dedicated "binary only" analysis would be necessary to analyse the high intensity runs. This has not been done so far.
The comparator in the ABCD readout ASIC can be operated in two modes: level and edge sensing. In level sensing mode a "1" is output whenever the sample is above threshold. In edge sensing mode the level is set to "high" during 25 ns on detection of a rising edge crossing the threshold. Thus, even for very long pulses only one "1" is written into the pipeline, thereby preventing the signal from spilling over into the next clock cycle (producing ghost hits in the next bunch crossing). Edge sensing is the baseline for the ATLAS experiment. Therefore, all data were taken in this mode.
The analysis below uses the data from the May 2000 test beam to directly verifies the correct functioning of the edge sensing circuit.
Data analysis
The data available in the low intensity runs are a complete set of threshold scans at different cable delays (that is different sampling moments with respect to the charge deposition (=trigger)). The ABCD provides binary hit information from three clock cycles centred on the trigger. Offline, we define an event to be efficient in a certain clock cycle if a hit is found within 100 microns from the track. Thus, for each event we obtain an "efficiency pattern" for the sample before, during and after the trigger.
Results
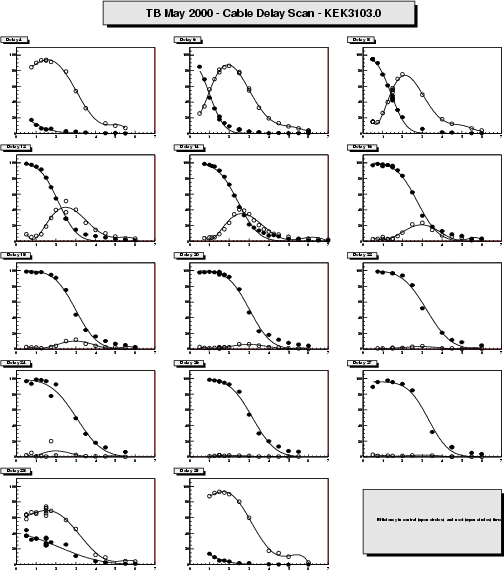
The figures below represent the efficiency as a function of comparator threshold (S-curve) for two clock cycles, the triggered or central clock cycle (black circles) and the one inmediately after that (or next) (open circles). The previous time bin was empty (except for noise hits) for these delay settings and is not shown.

Each figure corresponds to a specific cable delay in the range between 4 and 29 ns. The absolute numbers are meaningless as there is a random offset in the delay from signal cables etc. Also, from the way the trigger logic is constructed, a delay d is the exact equivalent to d+25 ns. This becomes clear when comparing the first and last figure, corresponding to 4 and 29 ns delays.
We see that the optimum delay is reached between 20 and 26 ns. For these delays, the median charge found in the triggered time bin is around 3.5 fC, compatible with the values found for these modules in later, conventional beam tests (thereby confirming the validity of the conventional "TDC cut" test beam analysis).
Moving to shorter delays, we find that the signal is divided between the central and next time bin. This leads to a low median charge in the central time bin. The efficiency in the next time bin, however, is suppressed at low threshold by the edge sensing comparator. If the sample reaches the threshold in the central time bin, the output for the next time bin is necessarily a "0".
In the 27 ns delay, the signal is on the edge of the previous time bin. This leads to a slight decay of the efficiency at the lowest thresholds. Now, hits in the previous time bin "kill" the hits in the central one.
Conclusions
The S-curve obtained for an optimised delay is compatible to the one found using a time cut in a conventional, random beam (see results from the same modules in the August test beam . This confirms the validity of the TDC cut approach.
The edge sensing circuit of the comparator does what it is expected to do: at low threshold the next time bin contains essentially no ghost hits due to signal from the triggered one.
![]() Last
update July 11, 2001
Last
update July 11, 2001
Marcel.Vos@ific.uv.es,