 | Since 2007 I'm working on boosted objects, in particular on the physics one can do with boosted top quarks. In this page I explain what this is all about. The text is intended for a broader audience than "just" my few thousand colleagues in the LHC experiment. I have tried to avoid technicalities. Please, let me know if some passages are still too obscure. |
Introduction
Let's start by explaining what the "boost" in "boosted objects" stands for. Of the many meanings of boost collected on Wikipedia (among which brand names for fruit juice, energy drinks and chocolate), physicists use "boost" to designate a particular type of Lorentz transformation that takes us between frames that travel with different velocities. A "boosted object" then refers to a particle that travels at high speed through our laboratory.
The Large Hadron Collider at CERN operates at a beam energy that is 3.5 times larger than the previous big machine (the Tevatron at FermiLab near Chicago). Particles that used to be too heavy to be produced with much speed (the collision simply didn't provide enough energy to "kick" them) will often be produced with very large boost. The most interesting particles of the Standard Model, the W and Z boson and the top quark, are in this category. Also the Higgs boson, if it exists, will often be produced with significant boost.
Typically, the heavy particles we're interested are not observed themselves, but decay into other particles that are captured by our detectors. The boost of the "mother" particle changes the way we observe its decay products in our experiment. The cartoon below should give you an idea.
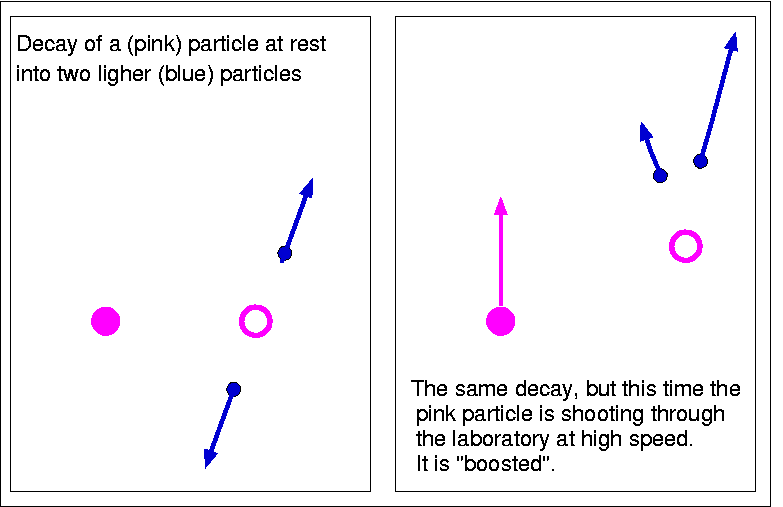
Imagine a heavy pink particle decaying to two lighter blue particles. If the pink particle is at rest in our experiment, the two shoot off in opposite directions. If one is observed in the upper half of the detector, we should search for the other in the lower half. If the pink particle is boosted, however, the topology of the decay is quite different. Both daughter particles are emitted in the same direction. For sufficiently large boost both daughter particles will be very close together in the detector.
Some of the most interesting decays at the LHC are into a quark-anti-quark pair (quarks are the constituents of protons and neutrons). Thanks to a number of concepts that are too weird to explain here, the experimental signature of a quark is a "jet" of particles. A quark is a bit like a fountain spraying particles in small region of the detector.
If a boosted particle decays into quarks and anti-quarks their jets will overlap, up to the point where one can no longer distinguish the individual jets. For sufficient boost the whole decay fuses into a single "fat" jet.
In 1994 some clever guy* thought it would be great if we were able to distinguish such "fat" jets from ordinary jets (that we produce by the millions even on a slow day in the LHC). This can be done by looking inside the jet at its internal structure. Since then, a rather sophisticated set of "jet substructure tools" has been developed to tackle this problem. Several groups performed simulations to demonstrate that analyses that had looked desperate, could be "saved" by taking advantage of boosted objects and the substructure of "fat" jets**.
At the start of serious LHC data taking in 2010, the one thing that was missing was some hands-on experience. Could we really trust our theoretical models of how jets develop? Would we be able to understand the detector response at the scales required for substructure measurements? So, a bunch of us set off to measure jet mass and substructure on a sample of highly energetic jets collected with the ATLAS detector in 2010. Two of our most important results are shown in the figures below.
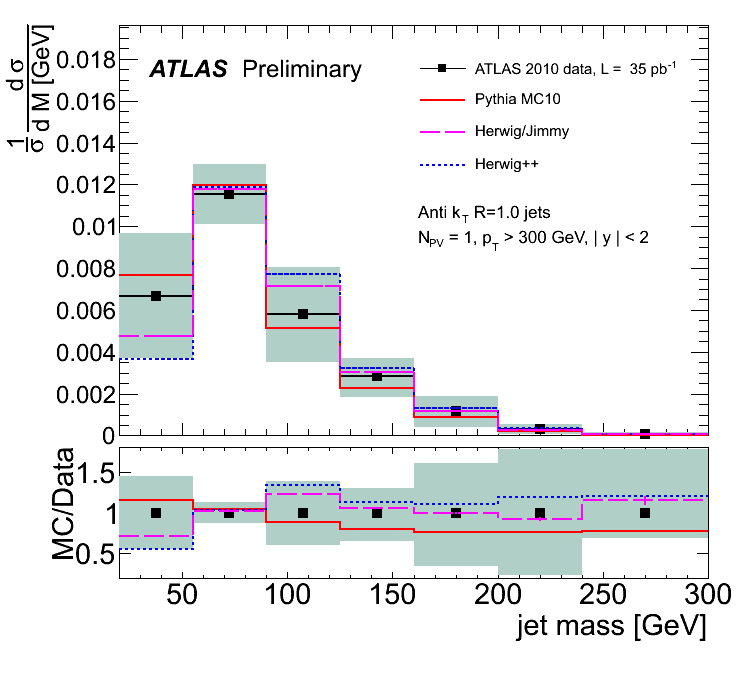 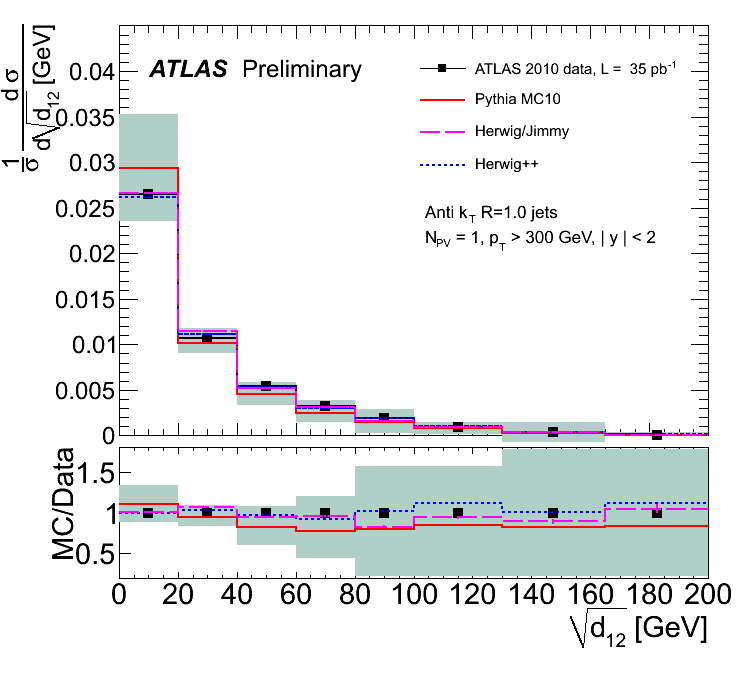
The black dots are our measurements. The greenish grey band is the uncertainty on the measurements. These are evaluated by taking into account everything that can go wrong in the detector and in the corrections we apply. The coloured lines are the prediction from three different Monte Carlo event generators. So, we learn that our models are OK within errors. We also get a feeling for how well we can measure things like jet mass and substructure. The errors are quite large at this early stage, because there are a lot of things that can go wrong. With time, we'll get more sophisticated about these measurements and the uncertainties will become smaller.
These results are available as an ATLAS note.
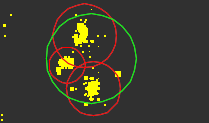
This is encouraging, but it gets even better. We skimmed through the sample of events ATLAS selected as likely top anti-top events looking for events where the tops were more energetic than average (we required the top-anti-top quark pair to have large invariant mass). We stumbled on a few events with interesting topologies. A display of the detector response for two of them is shown below.
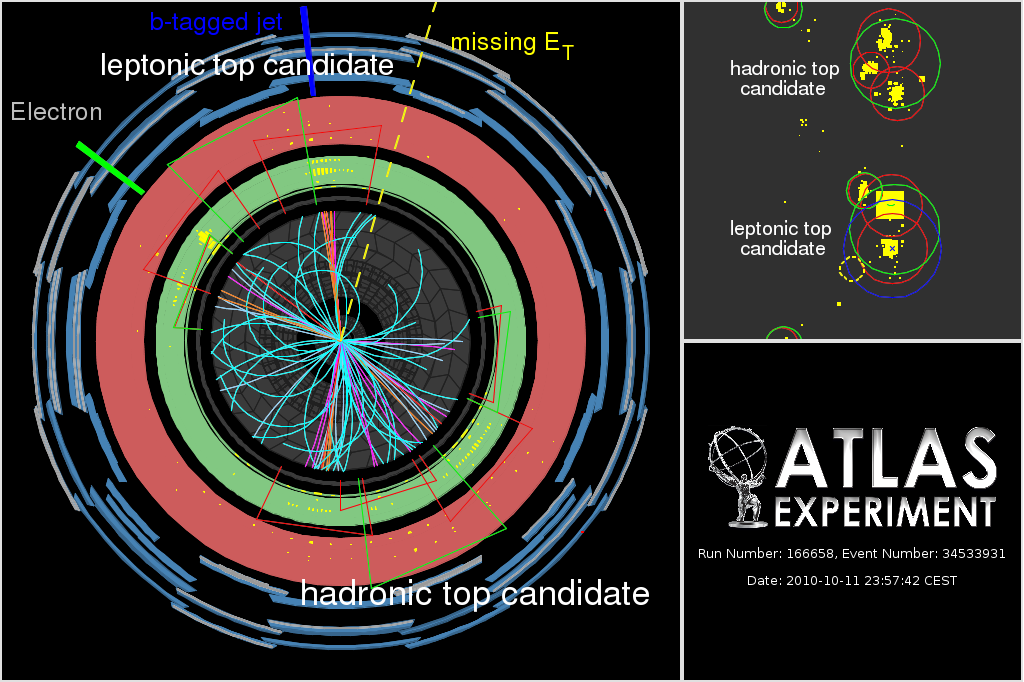 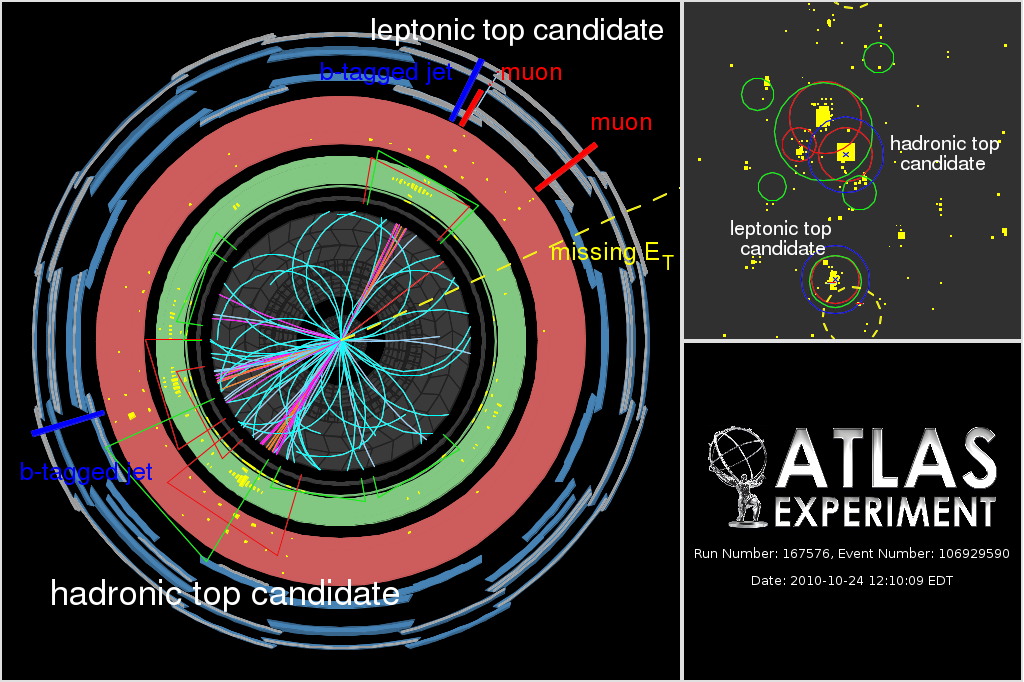
These displays are hard to read for outsiders, I'm afraid. The largest panel shows a view of the detector along the beam line. Protons collide right at the center of the picture. The coloured lines in the central part of the are charged particles formed in the collision. The pink trajectories correspond to highly energetic particle. The blue trajectories are soft, slow-moving particles that curl up in the strong magnetic field. The yellow dots in the green and red rings correspond to energy deposits in the calorimeter system that measures the energy of everything that comes out of the interaction. Several jets can be distinguished by eye as a dense region with many energetic tracks and large energy deposits. They are also indicated by the red and green conical objects.
For top-anti-top events we expect to see at least one lepton. We find an energetic electron in the uppermost event and a muon in the lowermost display. A neutrino should also be formed. These are funny particles that escape the detector without leaving a trace. We can infer their presence, though, by looking at the energy balance of the event. The magnitude and direction of the (transverse) energy that seems to be "missing" from the event (indicated in yellow) is a good first guess for the neutrino (transverse) momentum. We need one jet to complete one of the top decays. I've indicated this as "leptonic top candidate" in the displays. The second top quark decay should produce three jets.
The great thing about these events is that the three jets of particles that come out of this second top quark are so close together that they are reconstructed as a single jet. This is most readily seen in the unfolded view in the right upper corner of the displays. The three small red circles are jets reconstructed with fine resolution (technically, the R-parameter of the jet algorithm is set to 0.4). If we set the resolution coarser (R=1), these three small jets merge into a "fat" jet. When we reconstruct the mass of these jets it comes out very close to the top quark mass, as it should!
Miguel Villaplana (a PhD student at IFIC) presented these displays at the BOOST2011 conference in Princeton in May 2011, where the world's first "boosted heavy particle decays" were of course welcomed with applause***. For another account of the same event, have a look at this science blog in the Guardian.
In 2011 we will perform the first searches for heavy unknown particles using substructure techniques. Hopefully, more exciting news will follow soon.
Possibly, the most exciting result in our note is a couple of figures in an obscure section towards the end of the note. The section goes by the promising title of: "prospects for multiple proton-proton interactions". At the LHC we are so we feel so strongly about banging protons into each other that we produce multiple collisions every bunch crossing (and bunches cross 40 million times every second). The reason we do this is we need the luminosity: some of the processes we're after are so rare that if we don't produce billions of interactions we'll never get to the good stuff. These multiple proton interaction do pose a practical problem, though. The entire detector is flooded with soft particles from these extra interactions. The measurement of jet mass in big "fat" jets is severely affected. The figures below show how the mean jet mass depends on the number of interactions (we really measure the number of reconstructed primary vertices, but that's close enough to the number of interaction for this discussion).
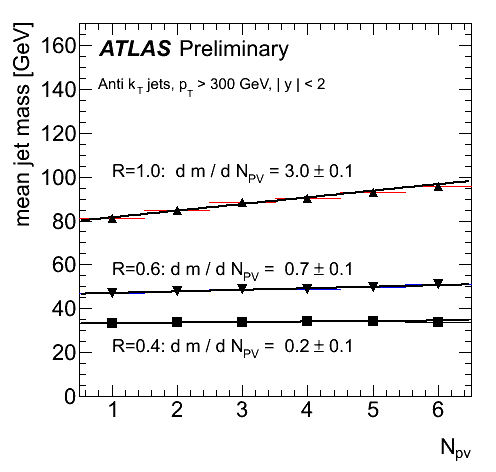 
If we look at the leftmost figure we find that, clearly, the larger the jet size (measured as this R-parameter, again) the larger the impact by this bath of random, soft particles. If you divide the slopes of the curves, you'll find it scales as R-cubed, as it should. Now, this was annoying in 2010, when we typically had 2 or 3 additional interactions. But, as the LHC luminosity increases, so does the number of additional interactions. As I write this text (June 2011) we're typically seeing 7 or 8 pile-up vertices. We had better come up with a bright idea fast!
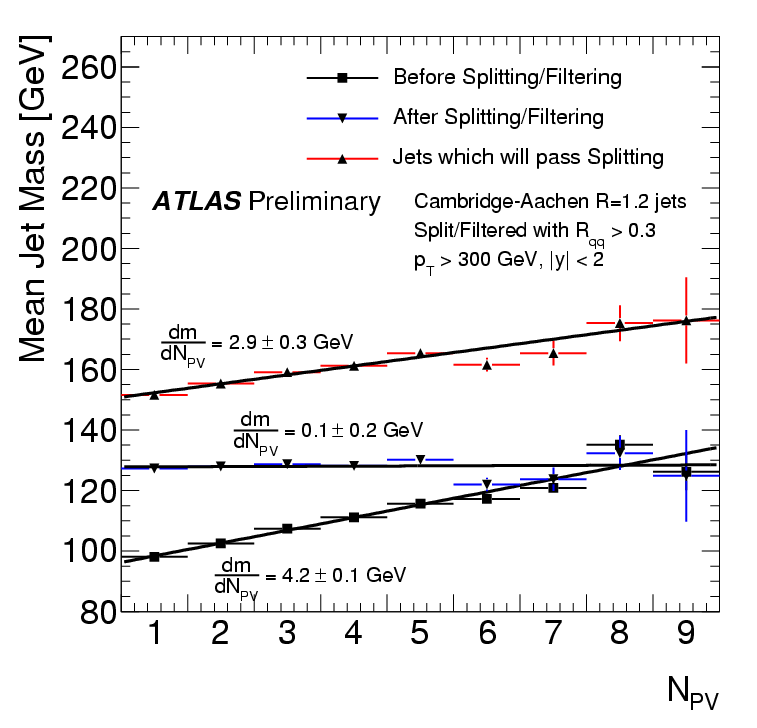
It turns out a possible solution was invented well before the start of the LHC. There is a family of techniques that go by descriptive names such as "pruning", "filtering" and "trimming". The generic name of this type of procedure is "jet grooming". These techniques dig out the interesting "hard part" of the jet substructure from among all the "soft stuff", thus yielding much sharper mass peaks AND reduced sensitivity to annoying real-life details like multiple proton-proton interactions. A comparison of how "pruning", "filtering" and "trimming" act on signal (boosted objects) and background (light quark jets) can be found in a report we edited last year. You'll also find references to the original papers proposing these techniques there.
The rightmost figure put filtering to the test and confirms - on data - that grooming works! While the raw (ungroomed) "fat" jets gain weight at a pace of 3-4 GeV per additional interaction, the filtered jets (in red) are practically undisturbed. Indeed, the fit of the line is compatible with 0 slope, i.e. no impact whatsoever****. This is, just possibly, very good news for the LHC experiments. If jet algorithms can be made insesitive to this "soft stuff", our measurements based on jets will no longer suffer the uncertainties in the modelling and measurement of this "soft stuff". Obviously, things are not that simple. We have only started to understand the full set of consequences of jet grooming. Clearly, much more work is needed to make sure that we don't run into a whole set of new problems that may be worse than the one we just solved. But, still, a promising idea is better than no idea at all.
So much for our contribution to BOOST2011. We're now working hard to meet yet another deadline. And we have to start looking into the paperwork for the organization of BOOST2012 in Valencia!
(*)The original paper is Mike Seymour, "Searches for new particles using cone and cluster jet algorithms: A Comparative study", Z.Phys.C62:127-138,1994.
(**)The BDRS paper is the most notorious example: J. M. Butterworth, A. R. Davison, M. Rubin, G. P. Salam, Phys.Rev.Lett.100:242001,2008, but this other paper actually contains many of the same ideas (and was published six years earlier): J. M. Butterworth, B.E. Cox, J.R. Forshaw, W W scattering at the CERN LHC, Phys.Rev.D65:096014,2002. A good, complete study on the particular case of boosted tops is found in this ATLAS note .
(***)Every ATLAS result is the work of at least 3000 people (not counting the people who built the LHC in the first place). Trying to single out personal contributions is something that should be avoided as much as possible. That said, I'd like to mention the chat with Francesco Spano (then at Columbia University in New York) in the CERN cafeteria that triggered the creation of these displays.
(****)The result corresponds to filtering, but we have good reasons to believe that the reduced sensitivity to soft contamination is a generic feature of all grooming algorithms. You may have noticed that the jet algorithm is different (Cambridge-Aachen as opposed to Anti-kT). Grooming techniques can be combined with any mainstream jet algorithm in one way or another.
|