Global Assembly Performance
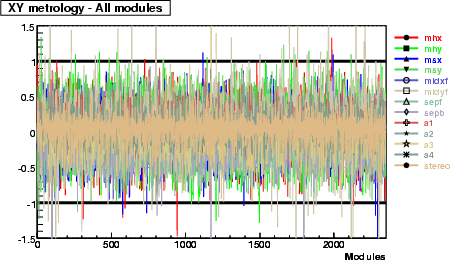
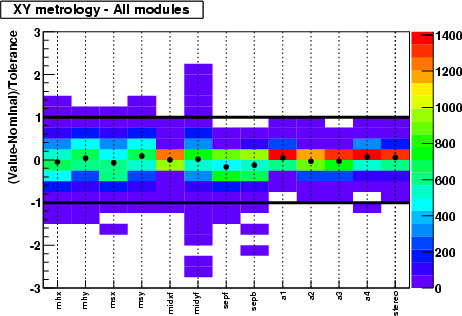
XY parameters
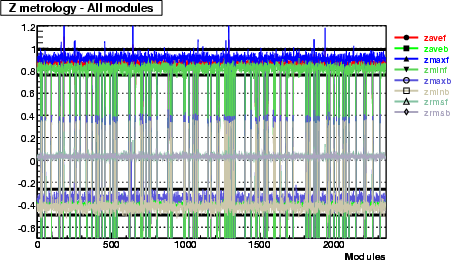
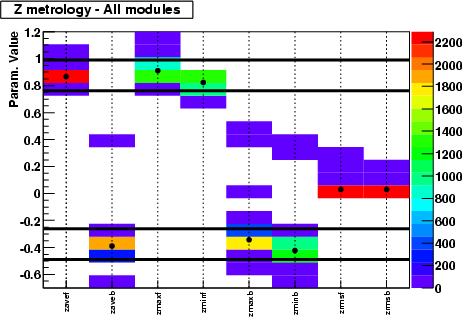
Z parameters
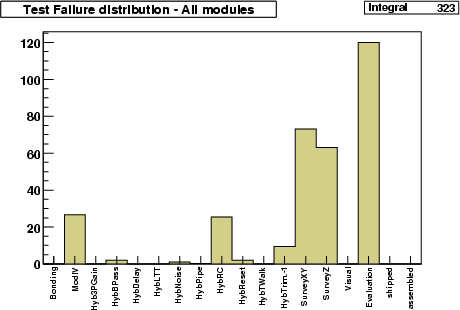
Test failure frequency
Next histogram (left) shows the frequency of failure of the different
tests. The normalization is made such that the total number of entries
in the histogram equals the number of bad modules.
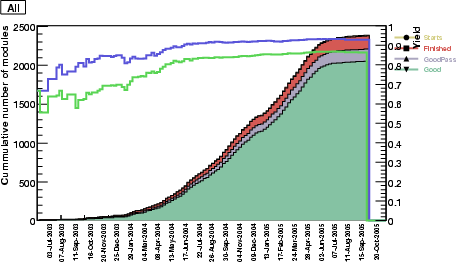
The histogram at the right shows the performance of the site in
terms of modules started, measured and the final yield. The
histogram is cummulative.
CE cluster
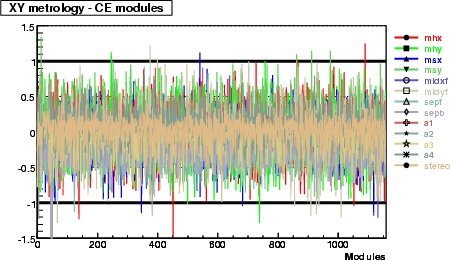
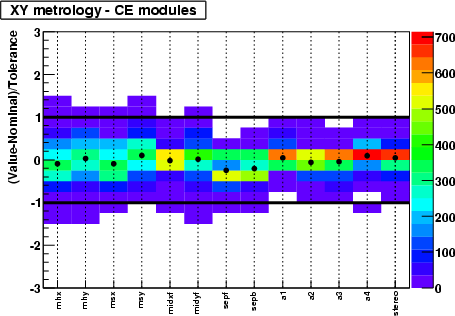
XY parameters
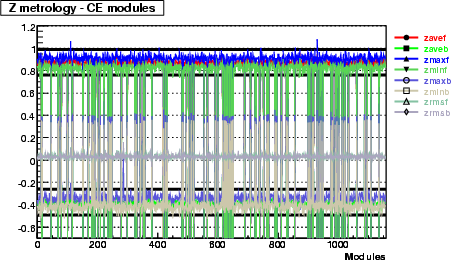
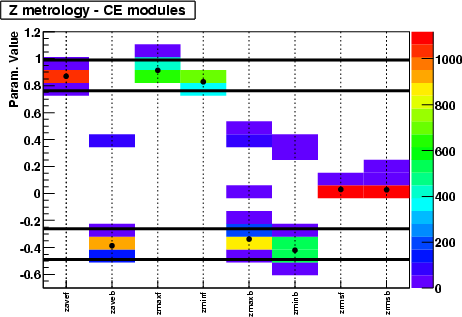
Z parameters
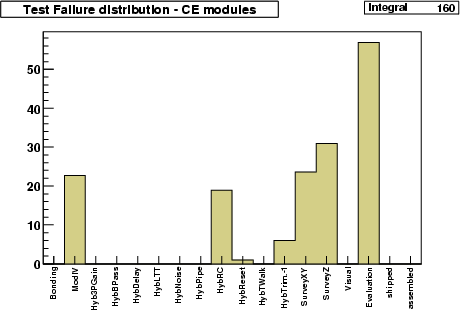
Test failure frequency
Next histogram (left) shows the frequency of failure of the different
tests. The normalization is made such that the total number of entries
in the histogram equals the number of bad modules.
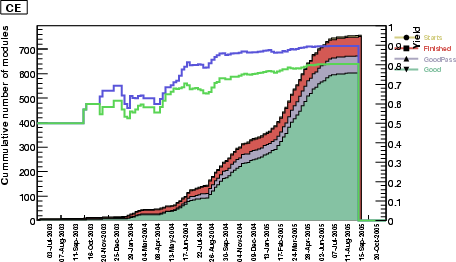
The histogram at the right shows the performance of the site in
terms of modules started, measured and the final yield. The
histogram is cummulative.
CS cluster
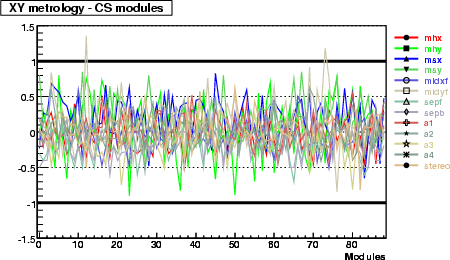
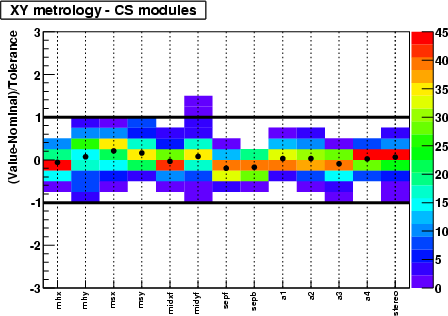
XY parameters
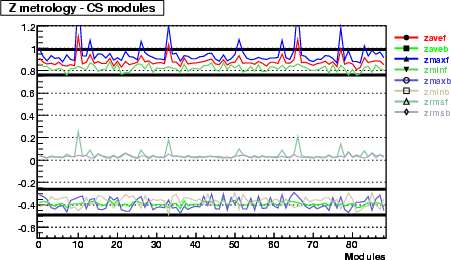
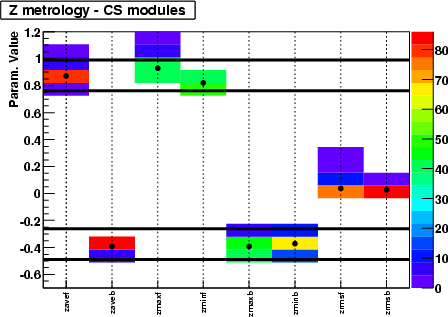
Z parameters
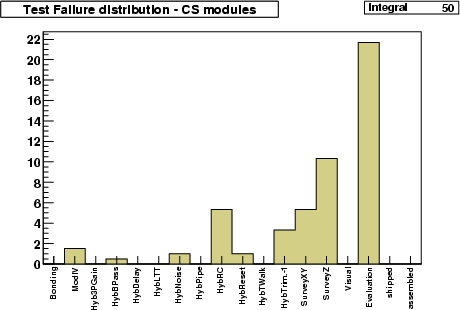
Test failure frequency
Next histogram (left) shows the frequency of failure of the different
tests. The normalization is made such that the total number of entries
in the histogram equals the number of bad modules.
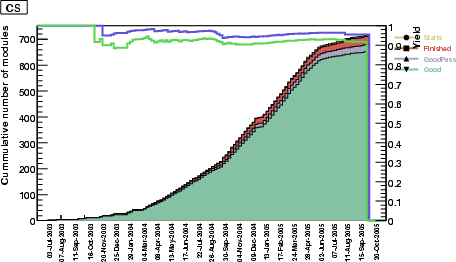
The histogram at the right shows the performance of the site in
terms of modules started, measured and the final yield. The
histogram is cummulative.
UK-V cluster
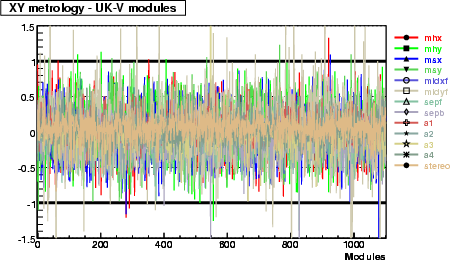
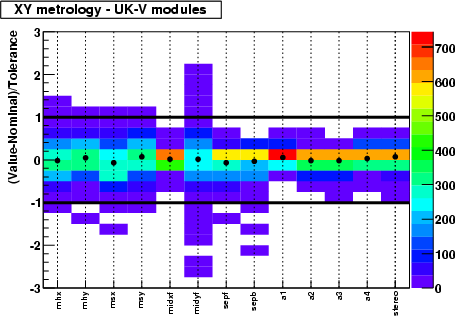
XY parameters
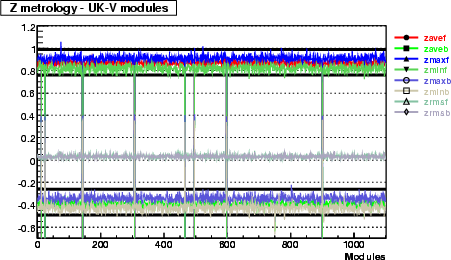
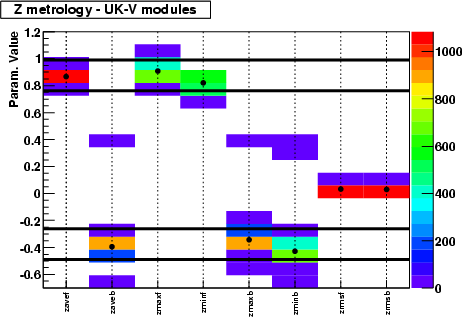
Z parameters
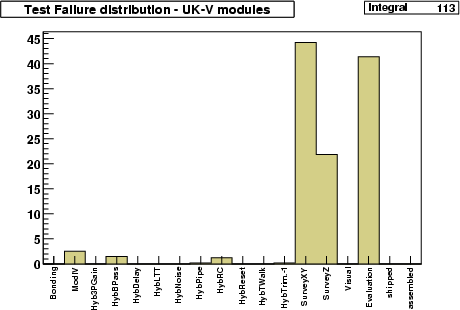
Test failure frequency
Next histogram (left) shows the frequency of failure of the different
tests. The normalization is made such that the total number of entries
in the histogram equals the number of bad modules.
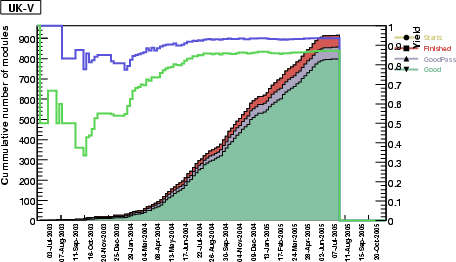
The histogram at the right shows the performance of the site in
terms of modules started, measured and the final yield. The
histogram is cummulative.
Freiburg cluster
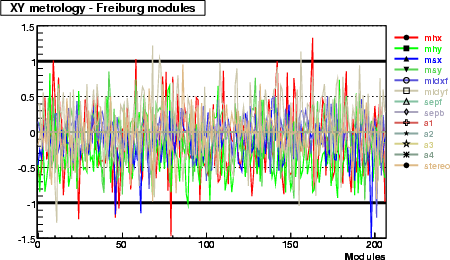
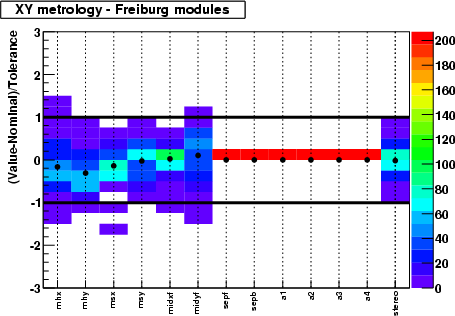
XY parameters
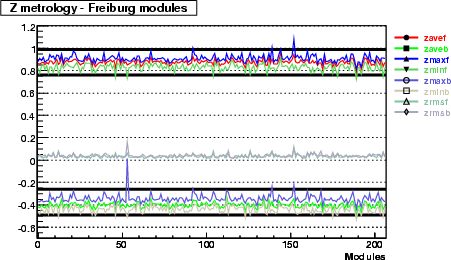
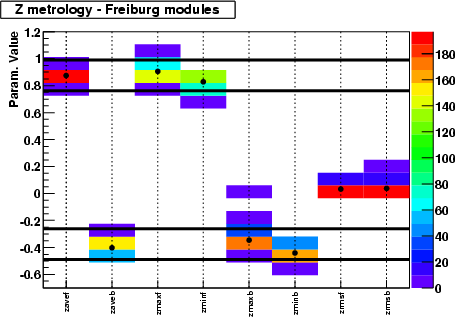
Z parameters
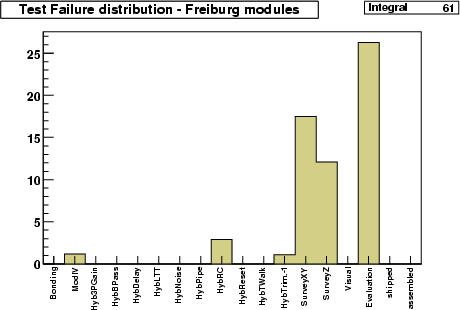
Test failure frequency
Next histogram (left) shows the frequency of failure of the different
tests. The normalization is made such that the total number of entries
in the histogram equals the number of bad modules.
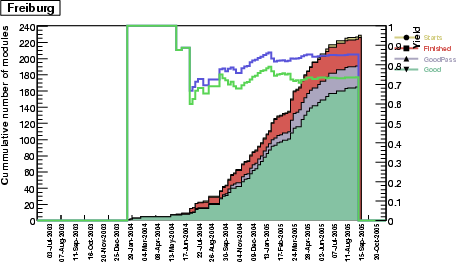
The histogram at the right shows the performance of the site in
terms of modules started, measured and the final yield. The
histogram is cummulative.
Geneva cluster
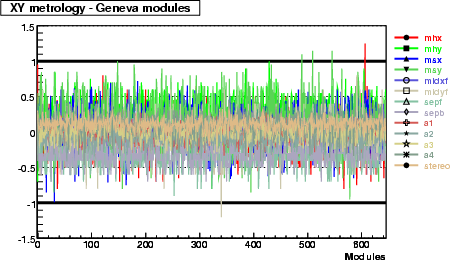
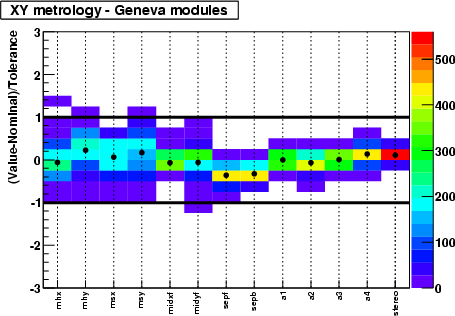
XY parameters
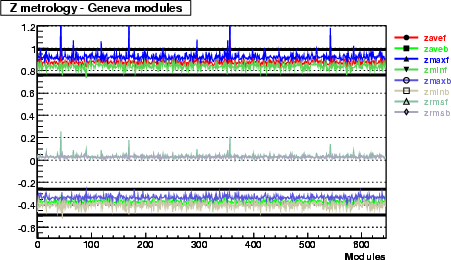
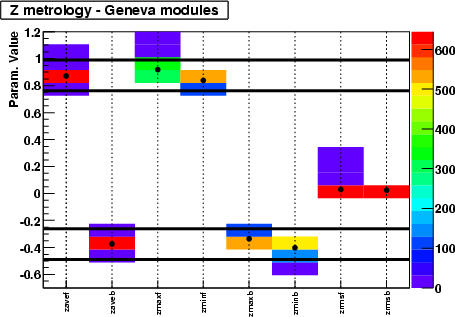
Z parameters
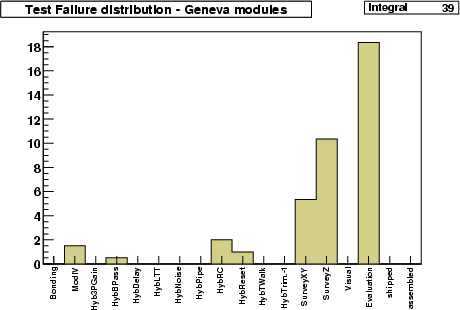
Test failure frequency
Next histogram (left) shows the frequency of failure of the different
tests. The normalization is made such that the total number of entries
in the histogram equals the number of bad modules.
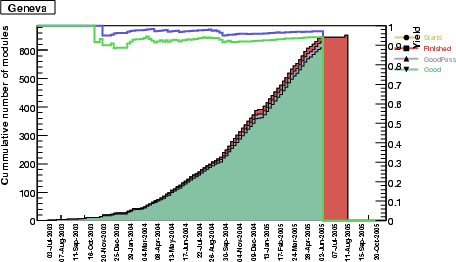
The histogram at the right shows the performance of the site in
terms of modules started, measured and the final yield. The
histogram is cummulative.
MPI cluster
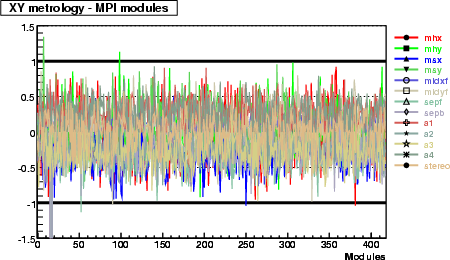
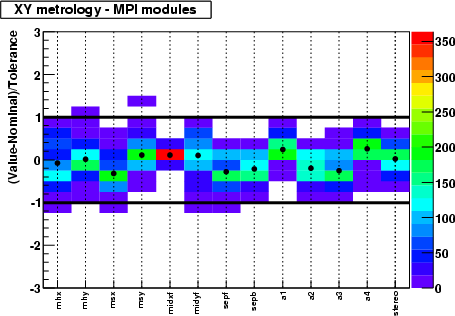
XY parameters
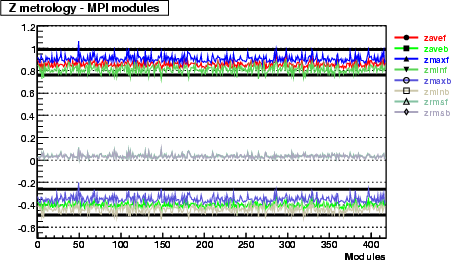
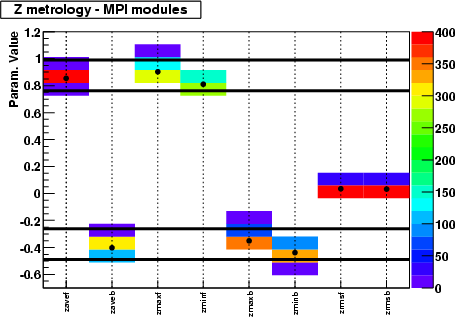
Z parameters
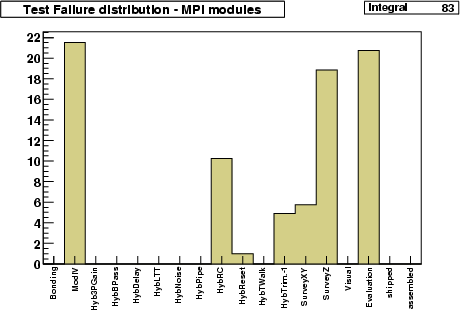
Test failure frequency
Next histogram (left) shows the frequency of failure of the different
tests. The normalization is made such that the total number of entries
in the histogram equals the number of bad modules.
The histogram at the right shows the performance of the site in
terms of modules started, measured and the final yield. The
histogram is cummulative.
MPI-MidL cluster
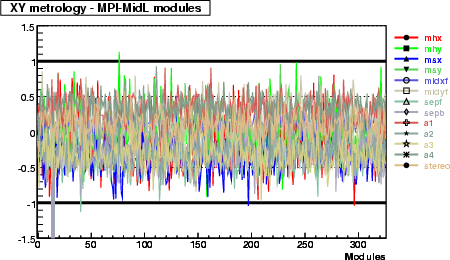
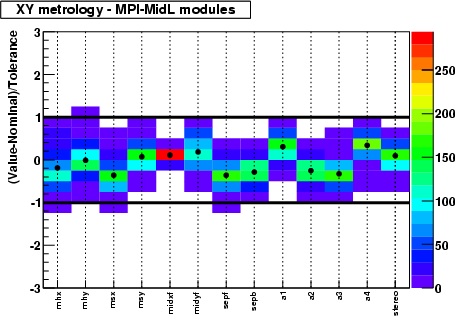
XY parameters
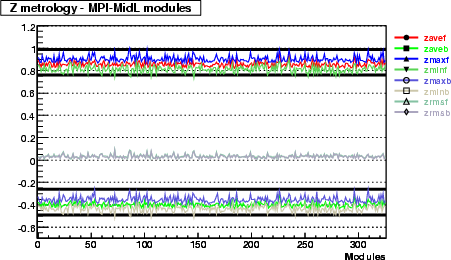
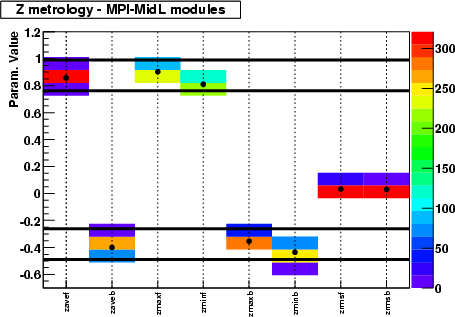
Z parameters
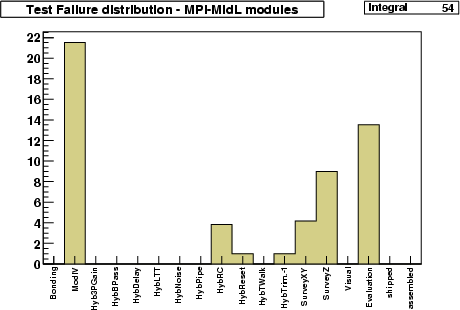
Test failure frequency
Next histogram (left) shows the frequency of failure of the different
tests. The normalization is made such that the total number of entries
in the histogram equals the number of bad modules.
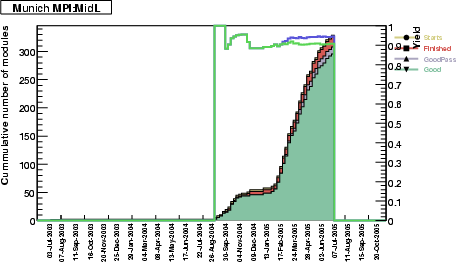
The histogram at the right shows the performance of the site in
terms of modules started, measured and the final yield. The
histogram is cummulative.
MPI-MidS cluster
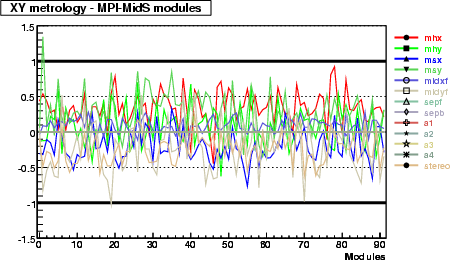
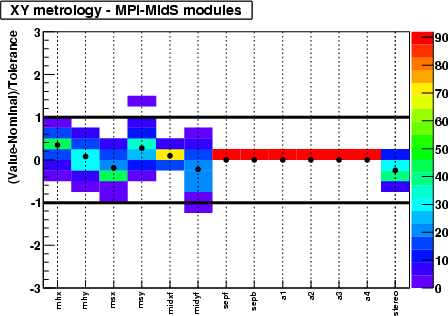
XY parameters
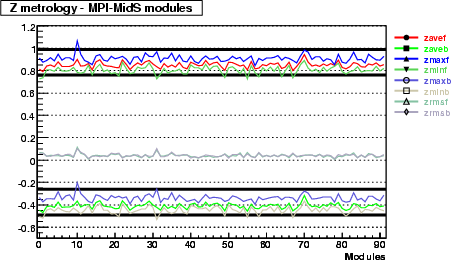
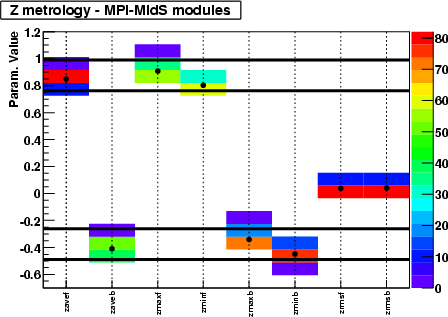
Z parameters
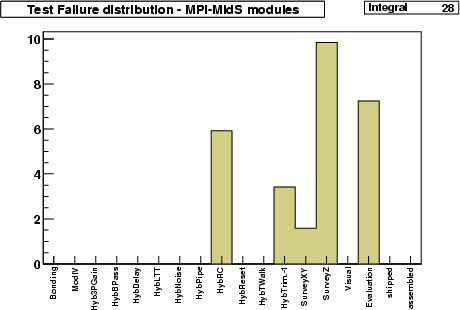
Test failure frequency
Next histogram (left) shows the frequency of failure of the different
tests. The normalization is made such that the total number of entries
in the histogram equals the number of bad modules.
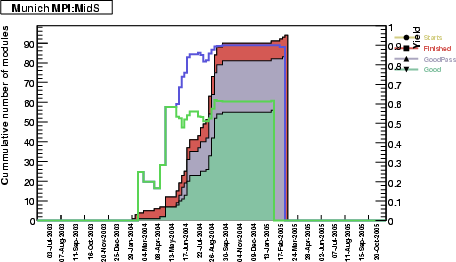
The histogram at the right shows the performance of the site in
terms of modules started, measured and the final yield. The
histogram is cummulative.
Manchester cluster
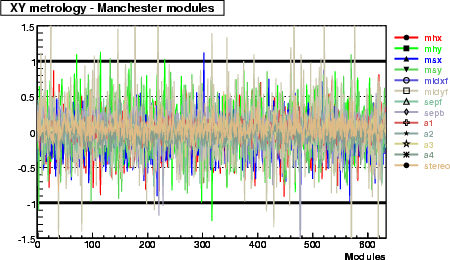
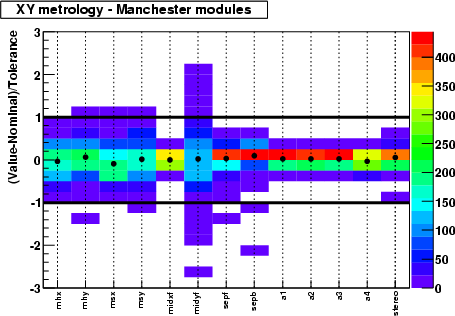
XY parameters
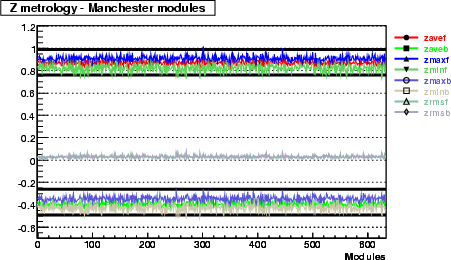
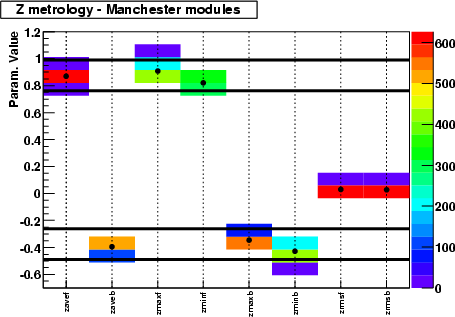
Z parameters
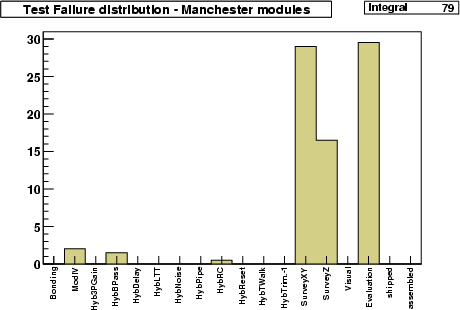
Test failure frequency
Next histogram (left) shows the frequency of failure of the different
tests. The normalization is made such that the total number of entries
in the histogram equals the number of bad modules.
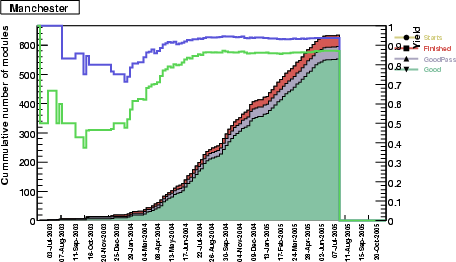
The histogram at the right shows the performance of the site in
terms of modules started, measured and the final yield. The
histogram is cummulative.
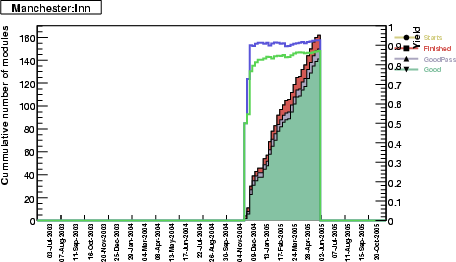
Manchester-Inn cluster
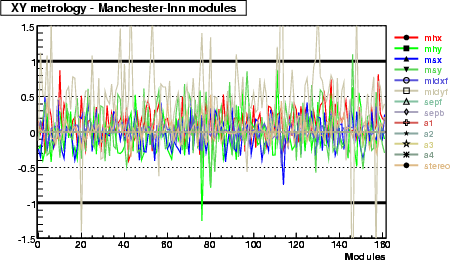
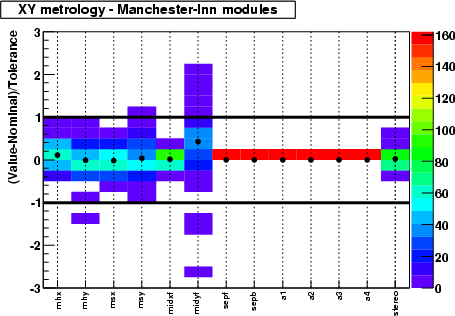
XY parameters
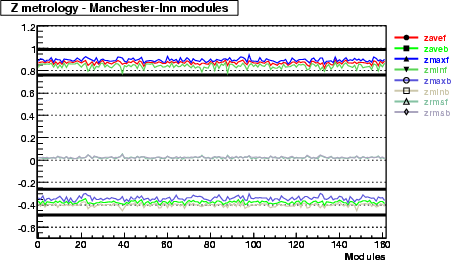
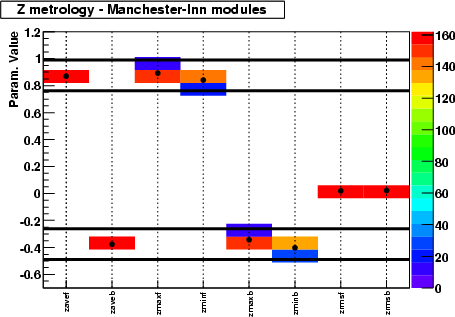
Z parameters
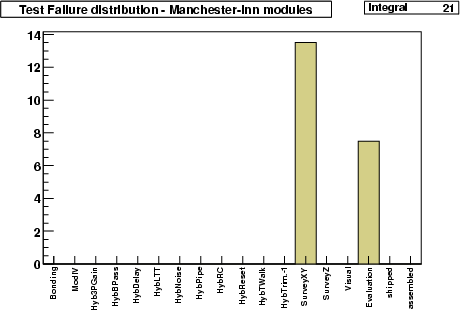
Test failure frequency
Next histogram (left) shows the frequency of failure of the different
tests. The normalization is made such that the total number of entries
in the histogram equals the number of bad modules.
The histogram at the right shows the performance of the site in
terms of modules started, measured and the final yield. The
histogram is cummulative.
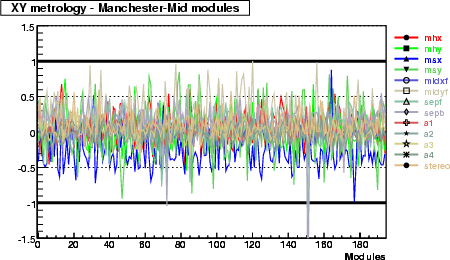
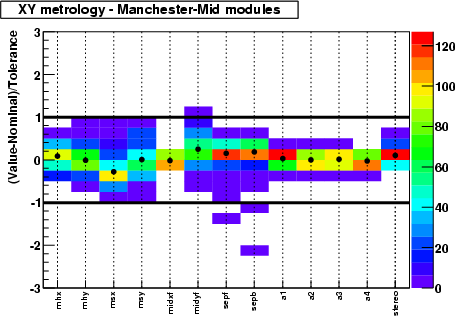
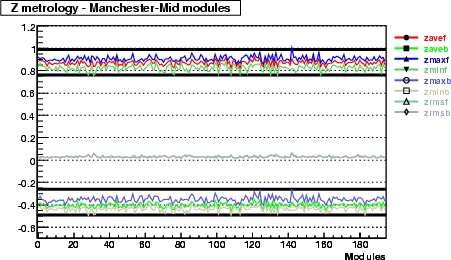
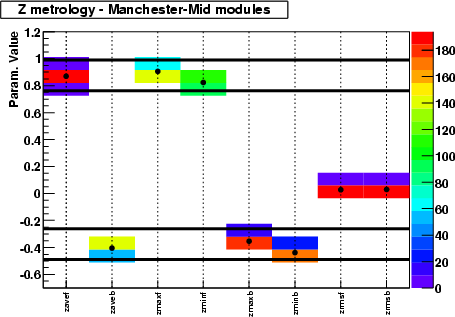
Manchester-Mid cluster
XY parameters
Z parameters
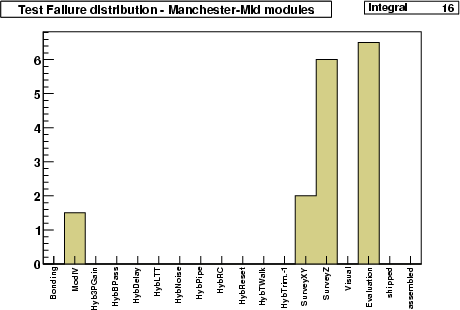
Test failure frequency
Next histogram (left) shows the frequency of failure of the different
tests. The normalization is made such that the total number of entries
in the histogram equals the number of bad modules.
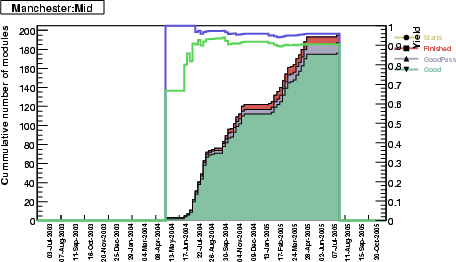
The histogram at the right shows the performance of the site in
terms of modules started, measured and the final yield. The
histogram is cummulative.
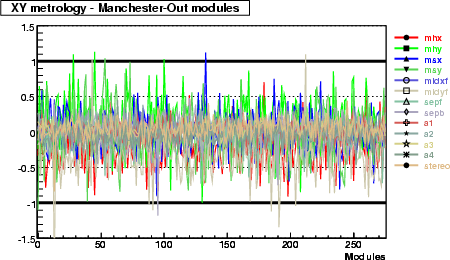
Manchester-Out cluster
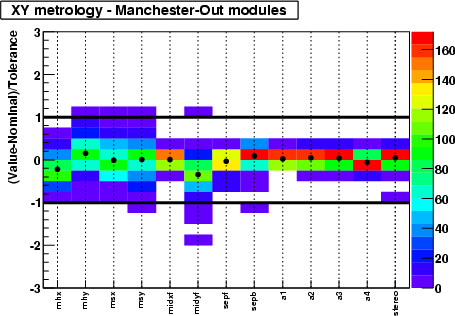
XY parameters
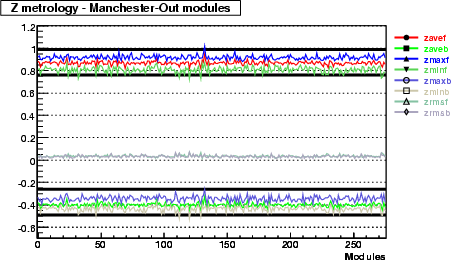
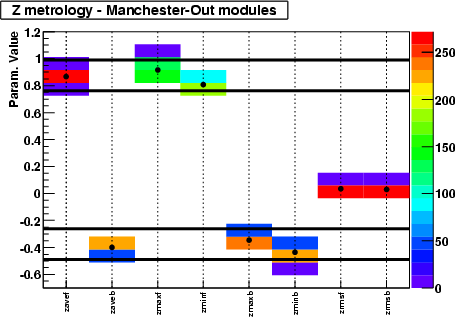
Z parameters
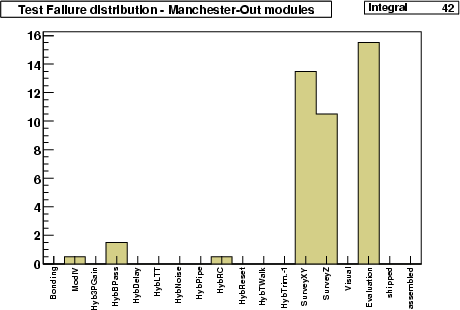
Test failure frequency
Next histogram (left) shows the frequency of failure of the different
tests. The normalization is made such that the total number of entries
in the histogram equals the number of bad modules.
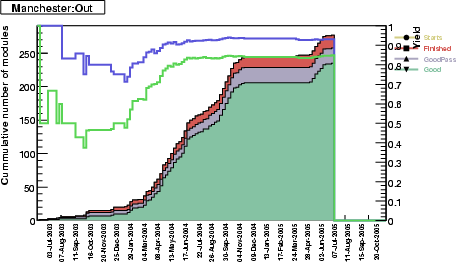
The histogram at the right shows the performance of the site in
terms of modules started, measured and the final yield. The
histogram is cummulative.
Melbourne cluster
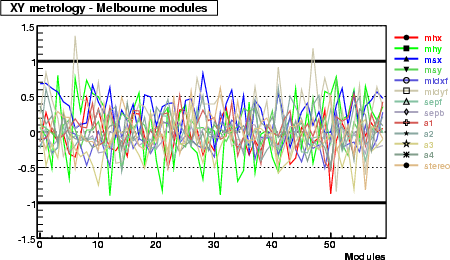
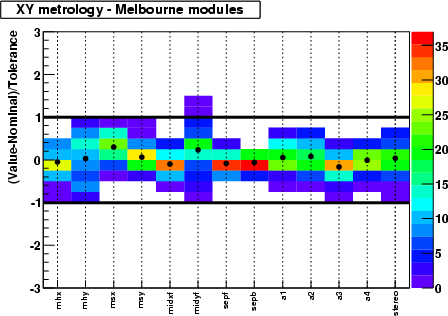
XY parameters
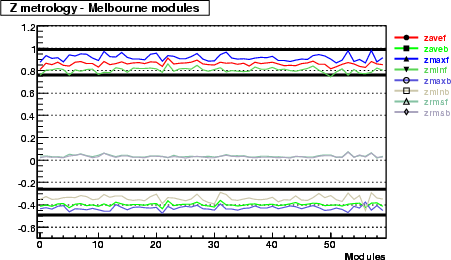
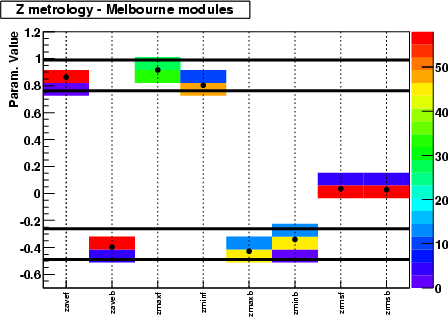
Z parameters
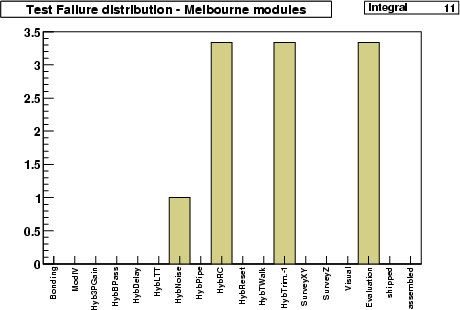
Test failure frequency
Next histogram (left) shows the frequency of failure of the different
tests. The normalization is made such that the total number of entries
in the histogram equals the number of bad modules.
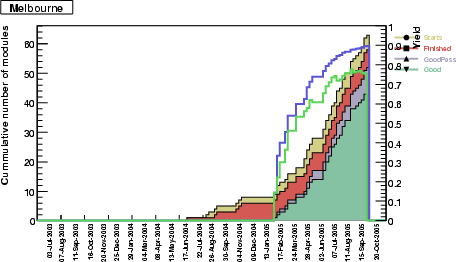
The histogram at the right shows the performance of the site in
terms of modules started, measured and the final yield. The
histogram is cummulative.
NIKHEF cluster
XY parameters
Z parameters
Test failure frequency
Next histogram (left) shows the frequency of failure of the different
tests. The normalization is made such that the total number of entries
in the histogram equals the number of bad modules.
The histogram at the right shows the performance of the site in
terms of modules started, measured and the final yield. The
histogram is cummulative.
Valencia cluster
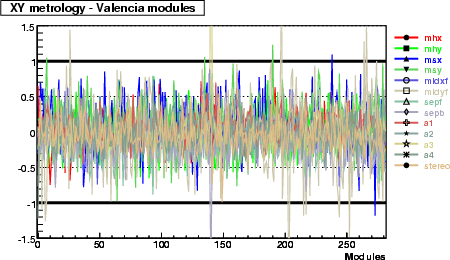
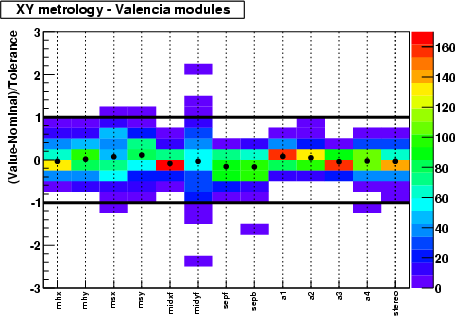
XY parameters
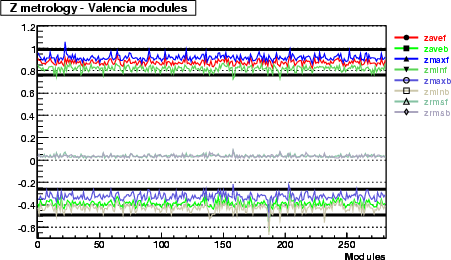
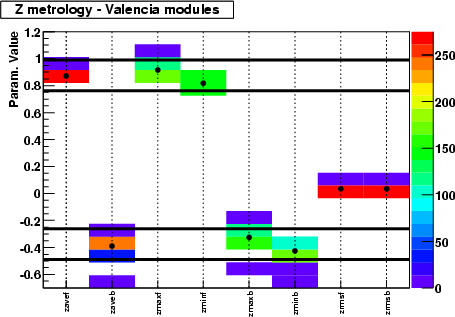
Z parameters
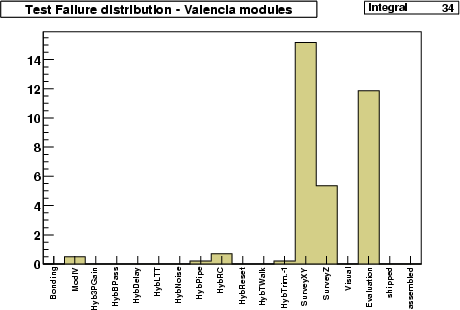
Test failure frequency
Next histogram (left) shows the frequency of failure of the different
tests. The normalization is made such that the total number of entries
in the histogram equals the number of bad modules.
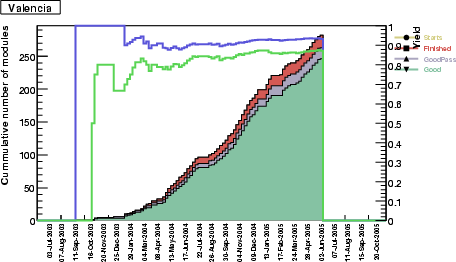
The histogram at the right shows the performance of the site in
terms of modules started, measured and the final yield. The
histogram is cummulative.
Valencia-Mid cluster
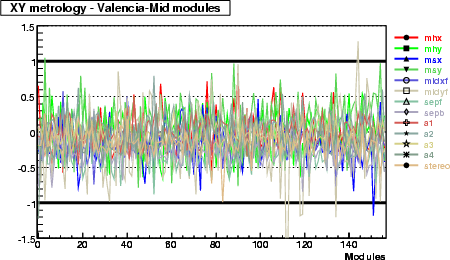
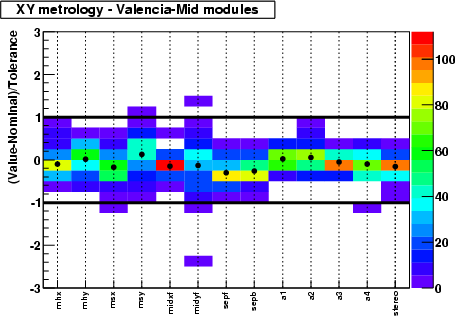
XY parameters
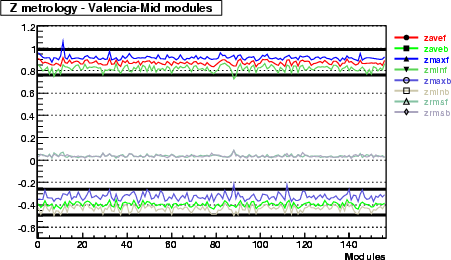
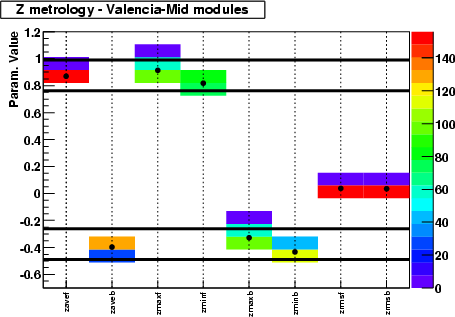
Z parameters
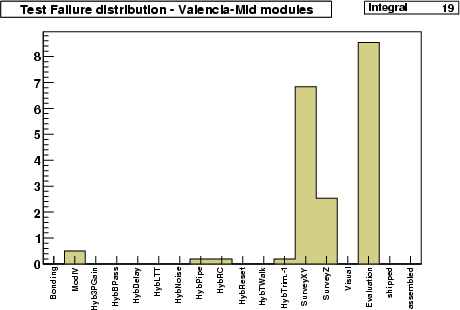
Test failure frequency
Next histogram (left) shows the frequency of failure of the different
tests. The normalization is made such that the total number of entries
in the histogram equals the number of bad modules.
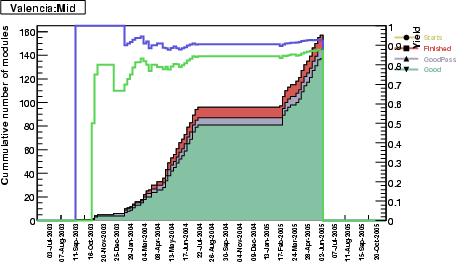
The histogram at the right shows the performance of the site in
terms of modules started, measured and the final yield. The
histogram is cummulative.
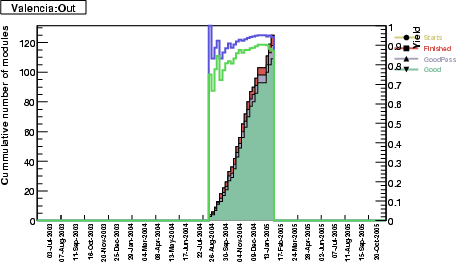
Valencia-Out cluster
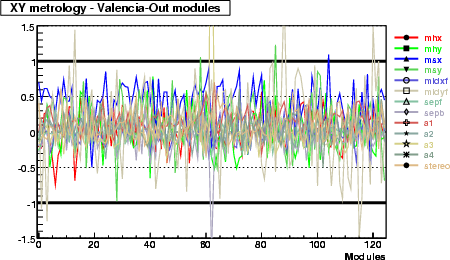
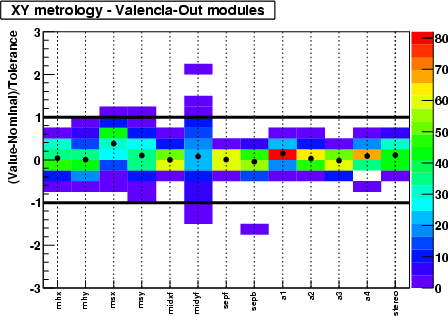
XY parameters
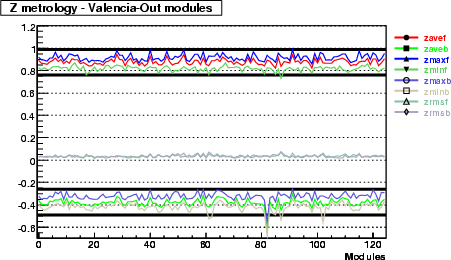
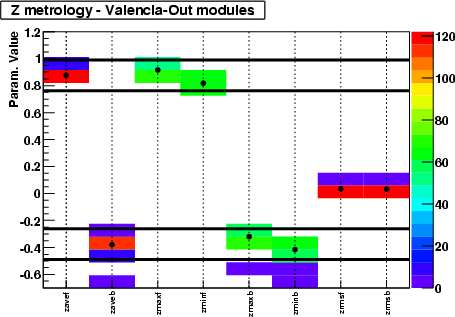
Z parameters
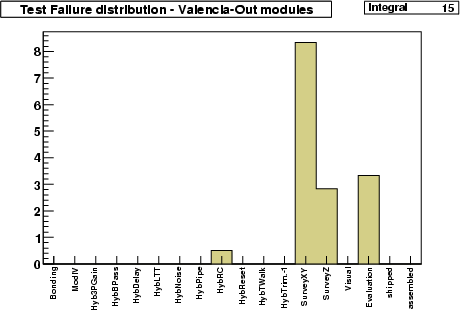
Test failure frequency
Next histogram (left) shows the frequency of failure of the different
tests. The normalization is made such that the total number of entries
in the histogram equals the number of bad modules.
The histogram at the right shows the performance of the site in
terms of modules started, measured and the final yield. The
histogram is cummulative.