This page shows the status of the endcap module production. The information that can be found here is:
Last update: 18-OCT-05
This table shows some statistics on End-cap module production. The total number of modules built refers to the number of assembled modules. Good modules are modules passing all the required tests, Pass are the number of modules in the PASS category and the same applies to Hold and Failed. Not tested modules are modules for which not all of the required tests have been made. Faile and untested modules are listed here.
The efficiency, or yield, is computed on the fully tested modules: good/(total-untested) or (good+pass)/(total-untested).
The Done column is computed as (ngood + npass)/(1.05 * todo) where todo is the actual number of modules without contingency.
The Needed column is a bit more involved and is computed as 1.05 * todo - ngood -npass -yield*untested. It indicates the number f modules which are still needed to account for the 5% contingency of the module onto disk assembly.
Remaining represents the number of modules remaining to complete the 20% contingency. It is computed as 1.2 *todo - built
For both Needed and Remaining, negative numbers represent an excess of modules.
| Summary | Built | Good | Pass | Hold | Failed | Not tested | Yield (G) | Yield (G+P) | Done(1) | Needed | Remaining (2) |
|---|---|---|---|---|---|---|---|---|---|---|---|
| All | 2389 | 2052 | 158 | 113 | 55 | 11 | 86.3% | 92.9% | 107.9% | -172. | -48. |
| Clusters | Built | Good | Pass | Hold | Failed | Not tested | Yield (G) | Yield (G+P) | Done(1) | Needed | Remaining (2) |
| UK-V | 916 | 798 | 60 | 46 | 12 | 0 | 87.1% | 93.7% | 107.2% | -58. | -2. |
| CS | 716 | 651 | 29 | 4 | 27 | 5 | 91.6% | 95.6% | 112.8% | -82. | -27. |
| CE | 757 | 603 | 69 | 63 | 16 | 6 | 80.3% | 89.5% | 104.1% | -32. | -19. |
| Types | Built | Good | Pass | Hold | Failed | Not tested | Yield (G) | Yield (G+P) | Done(1) | Needed | Remaining (2) |
| Outer | 1118 | 995 | 61 | 23 | 34 | 5 | 89.4% | 94.9% | 110.3% | -103. | -24. |
| Inner | 496 | 392 | 39 | 46 | 16 | 3 | 79.5% | 87.4% | 102.6% | -14. | -16. |
| MidL | 681 | 609 | 31 | 33 | 5 | 3 | 89.8% | 94.4% | 108.8% | -55. | -9. |
| MidS | 94 | 56 | 27 | 11 | 0 | 0 | 59.6% | 88.3% | 98.8% | 1. | 2. |
| Sites | Built | Good | Pass | Hold | Failed | Not tested | Yield (G) | Yield (G+P) | Done(1) | Needed | Remaining (2) |
| Freiburg | 229 | 165 | 26 | 28 | 7 | 3 | 73.0% | 84.5% | 98.3% | 1. | -7. |
| Geneva | 653 | 608 | 20 | 2 | 23 | 0 | 93.1% | 96.2% | 109.7% | -56. | 1. |
| MPI | 423 | 352 | 39 | 29 | 0 | 3 | 83.8% | 93.1% | 106.4% | -26. | -3. |
| MPI-MidL | 329 | 296 | 12 | 18 | 0 | 3 | 90.8% | 94.5% | 108.6% | -27. | -5. |
| MPI-MidS | 94 | 56 | 27 | 11 | 0 | 0 | 59.6% | 88.3% | 98.8% | 1. | 2. |
| Manchester | 634 | 552 | 43 | 31 | 8 | 0 | 87.1% | 93.8% | 107.3% | -41. | -0. |
| Manchester-Inn | 162 | 141 | 9 | 12 | 0 | 0 | 87.0% | 92.6% | 105.8% | -8. | 0. |
| Manchester-Mid | 195 | 176 | 11 | 6 | 2 | 0 | 90.3% | 95.9% | 111.3% | -19. | -3. |
| Manchester-Out | 277 | 235 | 23 | 13 | 6 | 0 | 84.8% | 93.1% | 105.5% | -13. | 3. |
| Melbourne | 63 | 43 | 9 | 2 | 4 | 5 | 74.1% | 89.7% | 165.1% | -25. | -27. |
| NIKHEF | 105 | 86 | 4 | 6 | 9 | 0 | 81.9% | 85.7% | 97.4% | 2. | 1. |
| Valencia | 282 | 246 | 17 | 15 | 4 | 0 | 87.2% | 93.3% | 107.0% | -17. | -1. |
| Valencia-Mid | 157 | 137 | 8 | 9 | 3 | 0 | 87.3% | 92.4% | 106.2% | -9. | -1. |
| Valencia-Out | 125 | 109 | 9 | 6 | 1 | 0 | 87.2% | 94.4% | 108.1% | -9. | -0. |
(1)The percentage of completion is calculated as the ratio between the number of G+P modules built and the total number of G+P plus the 5% contingency corresponding to the module to disk assembly.
(2)The number of remaining G+P modules is estimated as the number needed to complete the original commitment of G+P modules plus the 5% contingency corresponding to the module to disk assembly. Note that the untested modules are counted in this calculation together with the current estimate of the G+P yield. A negative value means overproduction.
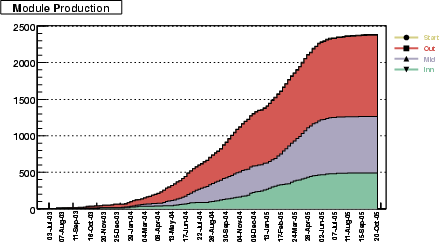
The plot below shows the evolution of the production for the different module types. Numbers correspond to number of modules built which have all the required tests made, that is, Good+Fail+Hold. Plots are stacked so that the envelope corresponds to the total number of modules. The dates are those of the last test made on the module.
The tables below show the modules taht are already either at Liverpool or at NIKHEF.
| Outer | MidL | MidS | InnH | InnC | ||||||||
|---|---|---|---|---|---|---|---|---|---|---|---|---|
| UK | VLC | GVA | Melb. | UK | VLC | MPI | MPI | UK | Frb | NKF | Frb | |
| Liverpool | 229 | 106 | 136 | 0 | 141 | 19 | 131 | 40 | 123 | 0 | 9 | 70 |
| 476 | 291 | 40 | 123 | 79 | ||||||||
| NIKHEF | 20 | 12 | 472 | 0 | 46 | 126 | 154 | 43 | 0 | 107 | 80 | 4 |
| 506 | 326 | 43 | 107 | 84 | ||||||||